
Key takeaways
- Researchers are using satellite images to identify areas prone to obesity through neural network analysis.
- The method involves examining environmental factors such as trees and roads surrounding individuals.
- This approach has a reliability rate of approximately 65 percent and is cost-effective and rapid.
 Neural networks are very popular in the field of artificial intelligence applications like object detection or image classification. Now researchers have discovered a way to find out obesity-prevalent areas with the aid of convolutional neural networks.
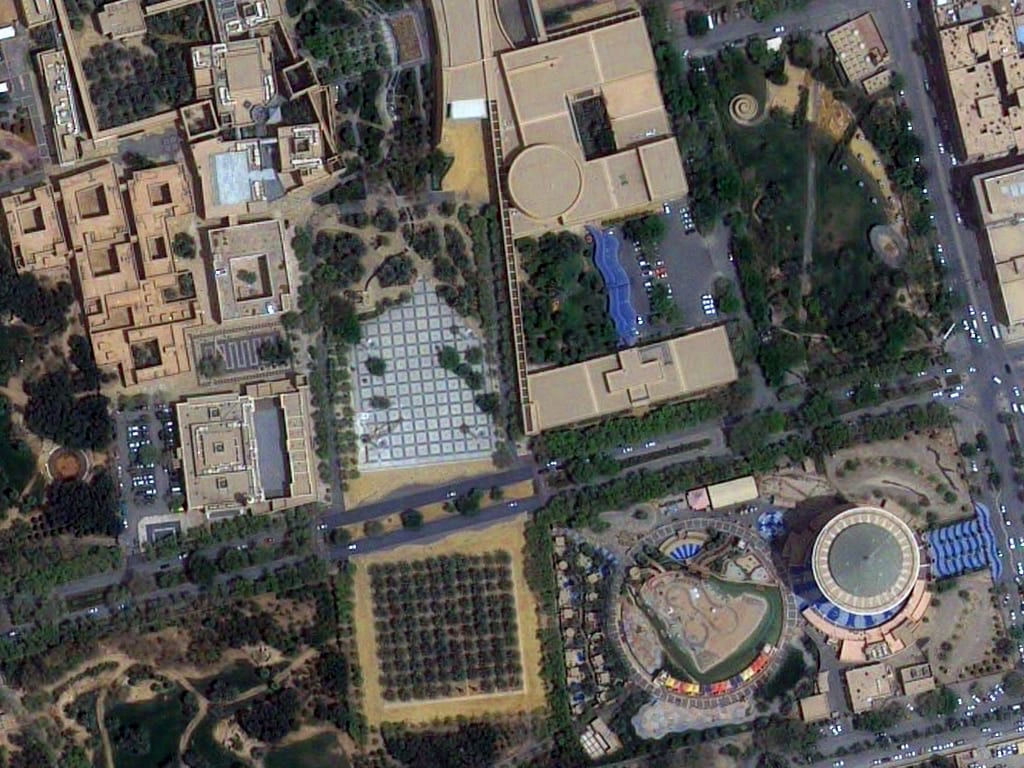
Researchers from the University of Washington, Seattle, have been taking satellite images of the earth and using them to find which people are prone to obesity. The satellite records the surrounds of people living or working in a specific area which is later used to analyse obesity-prone people by gauging habits they might have or are likely to develop based on their surrounding environments. Though this analysis is 64.8 percent reliability, it is quite inexpensive and swift.
Method
For this study, the researchers downloaded 150,000 satellite images from Google maps of 1695 census tracts for six cities, Los Angeles, Memphis, San Antonio, Seattle, Tacoma and Bellevue. They used neural networks to train with these images. By observing the trees, roads and other elements around, the neural network gave the estimate of the rate of obesity in the area. The system did not figure out the chances of obesity of a person, but in general of the people living in a region. Obesity is generally linked to traits like physical activity, diet, genetics and the surrounding environment. It is defined as a BMI which is the weight in kilograms divided by the height in meters squared, greater than 30. The analysis was done broadly in two steps:- Image extraction: Extracting high-dimensional images from the satellite and identifying the important features by applying convolutional neural networks to them. Also, acquiring the processed point of interest (POI).
- Correlation hunt: Elastic net regression was used to build a model to access the relationship between obesity prevalence and the environment.
 The network used in this case was a VGG-CNN-F network. It has five convolutional and 3 fully connected layers and this network was trained using 1.2 million satellite images from the ImageNet database. It was then used to assign the objects in the images to each of the categories. This network learns to extract gradients, edges and patterns that help in object detection.
Outputs for each image were collected from one of the fully connected layers. This layer had 4096 nodes and each of these has a non-linear connection, with all other nodes in the previous and next layers. Each feature vector has 4096 dimensions corresponding to the output of these nodes. Mean of all the features belonging to a census tract was found out. To know whether their CNN could differentiate between the built environment features, they made a forward pass through the network for a randomly selected set of images and observed the output from the convolutional layers. The image features were also distinguished based on the categories of obesity prevailing and not prevailing.