Article Complete
    AIM

    7 Types Of Infographics

    7 Types Of Infographics

    Discover the 7 types of infographics that can simplify complex information. Learn how to choose the right style for your data storytelling!

    7 Types Of Infographics
    AIM Media House··Updated DECEMBER 30, 2024, 5:30 AM
    5 min
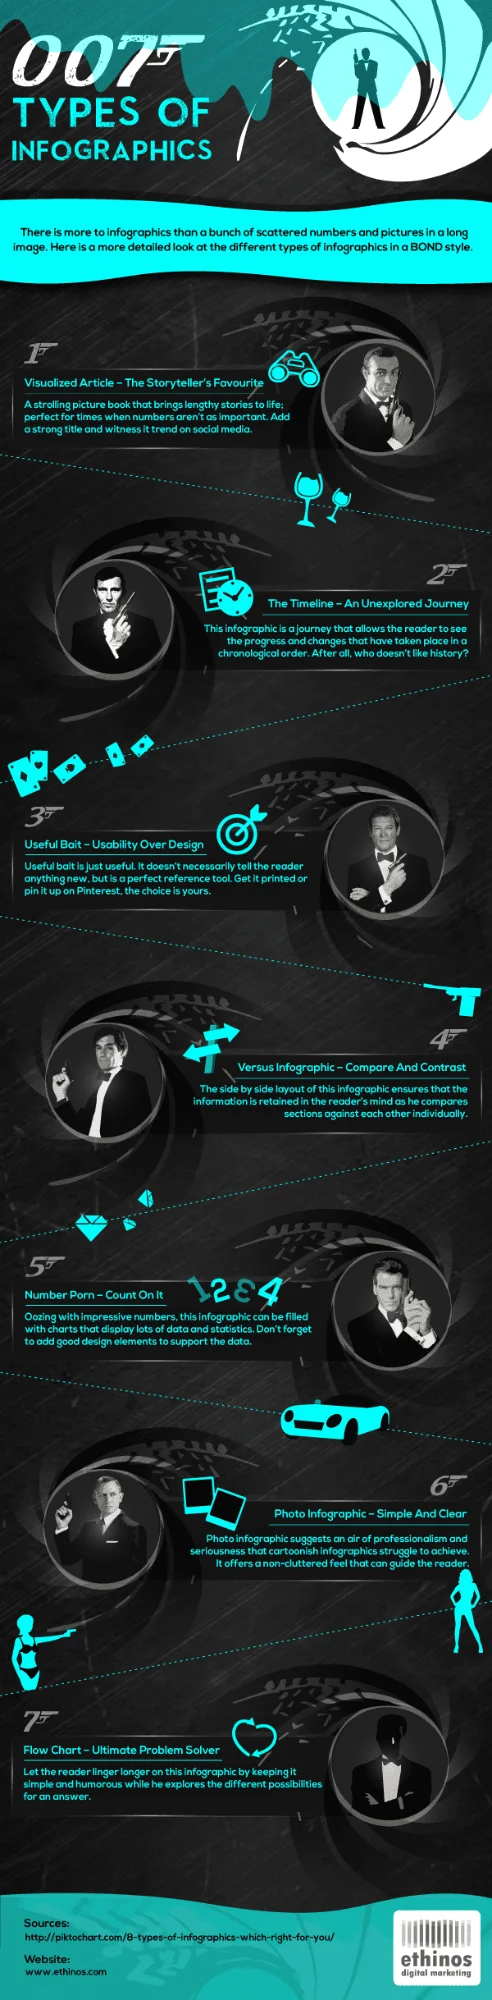
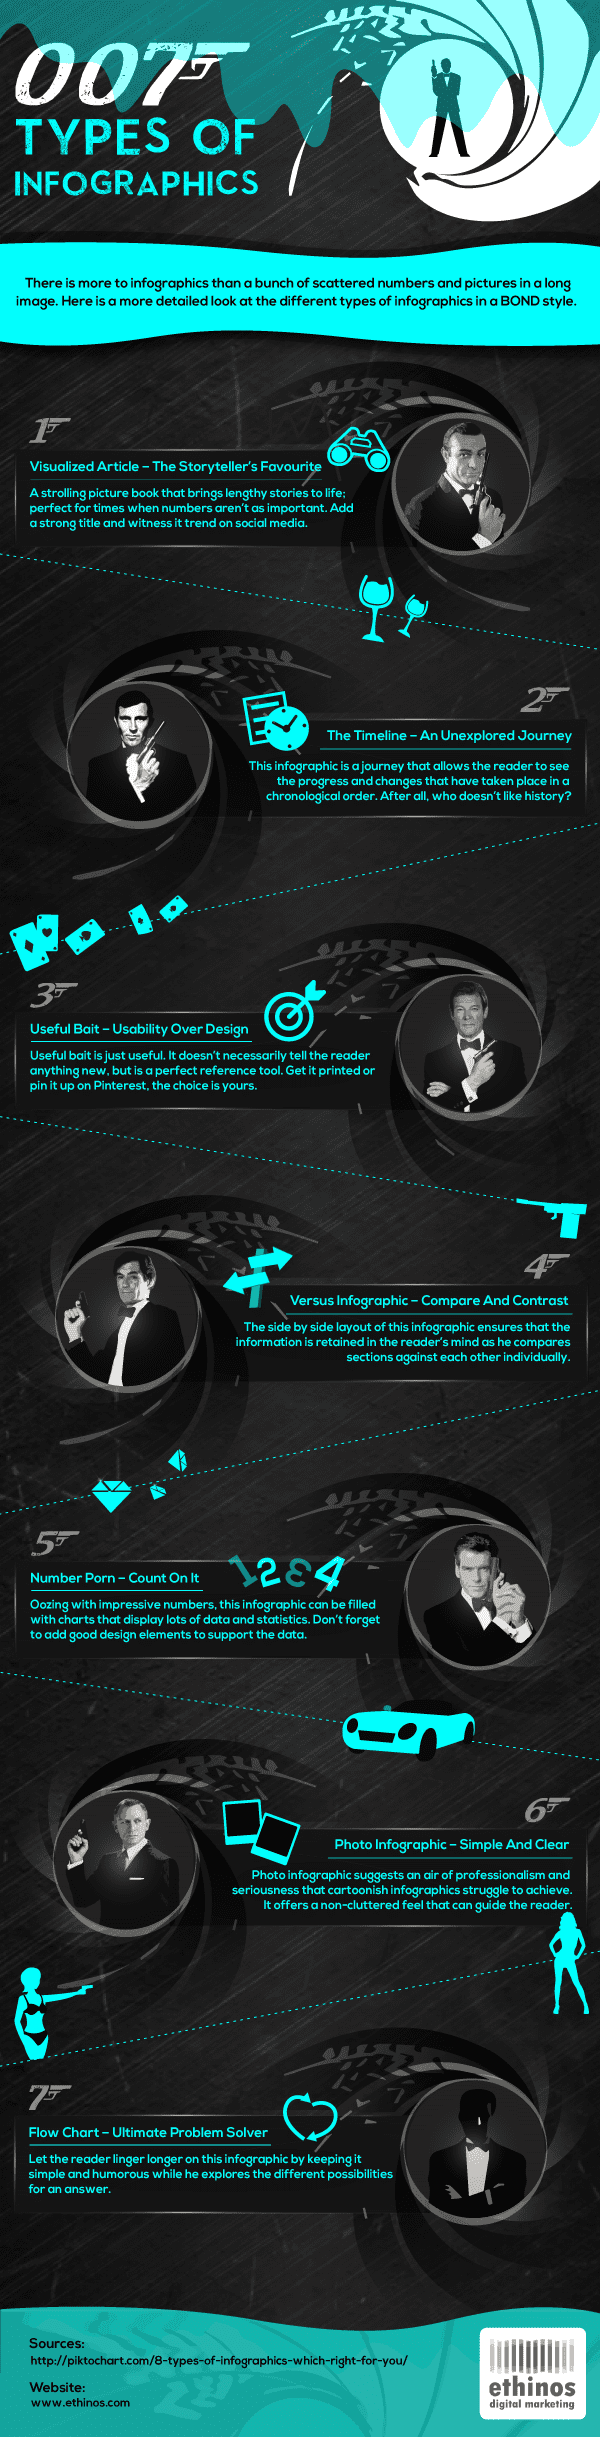
    Do you want to present complex information in a simple, elegant and beautiful way? Weaving a visually appealing story and adding a human context to it can make those pixels an interesting read. While we know that there is no stock standard template, choosing the right kind of infographic that matches your data to your narrative can be a herculean task. The piece of information that you share should be full of relevant data, illustration and anecdotes which can be easily understood by an amateur. The below infographic helps you in selecting the style that’s just right to keep the readers hooked till the last word! 7-Types-Of-Infographics
    Your reaction

    Discussion

    What's your take on this story?

    0/1000

    No comments yet — be the first to share your view.

    Explore our newsletters

    Build your routine with some of our top newsletters or view them all here.

    Wake up informed

    Make sense of the day's AI news and breakthroughs with our morning briefing.

    Belamy
    WeeklyBelamySee the latest

    Industry intelligence

    Receive a roundup of AI adoption stories by industry vertical, curated for professionals.

    3x WeeklySector6See the latest

    By signing up, you agree to our Privacy Policy.

    Membership

    Stay ahead with AI insights.

    Unlimited access to premium articles, exclusive analysis, and the stories shaping India's AI economy.

    Subscribe now

    AIM Americas

    1190 Miraloma Way Suite P, Sunnyvale, CA 94085

    AIM India

    1st Floor, Sakti Statesman, Bellandur, Bengaluru – 560103

    © 2026 AIM. All rights reserved.