Suffice to say that any Indian childhood is almost incomplete without a rendezvous with India’s evergreen comic hero Suppandi. Suppandi was the antithesis of a typical protagonist, goofing up almost on every task assigned to him. Most of the stories of Suppandi start with him being given a piece of advice and then Suppandi just applies it in an instance where he messes up something and comes across being unintelligent, despite the learning and new knowledge he acquired at the start of the story. I think nothing explains the problem of overfitting in machine learning algorithms better than Suppandi stories.
The first part of Suppandi story is almost the training phase (learning phase) equivalent of a machine learning algorithm, with the second part the testing phase (apply phase) where he tries to apply his learning and gets it all wrong. That is what happens when ML algorithms try to learn from every data point without generalisation.
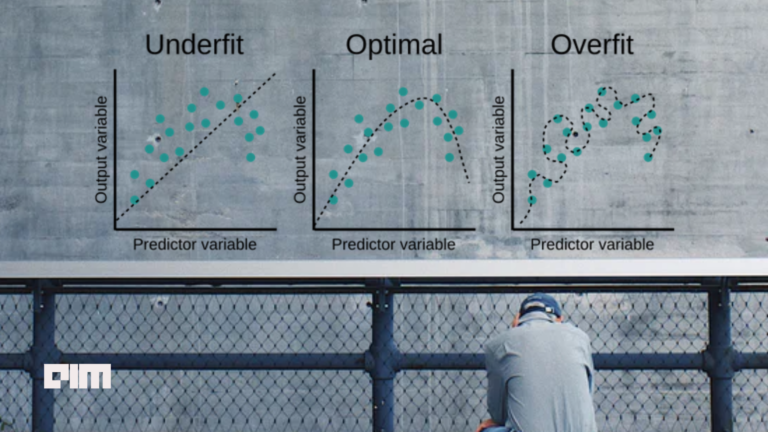
Overfitting
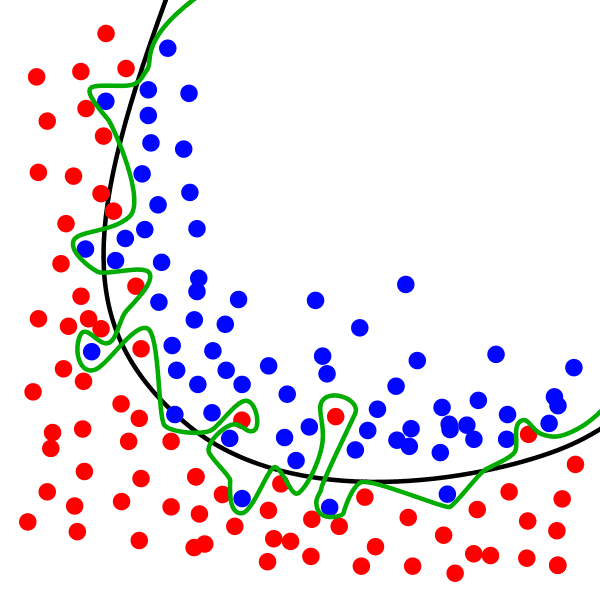
In my previous article, I talked about the choice of cost functions in curve fitting problems. The cost function tends to overfit the training samples when the representative curve is complex and the number/value of parameters of the curve are large — this can be seen in the figure below. So how do we make the “curve of fit” to both learn broad patterns from the training data, yet be robust to be applicable on unseen data? The technique to achieve this seemingly mind-boggling task is called regularisation.
The literature talks of three regularisation techniques that have again deep connections with the Lp-norms we saw in the previous article. We shall see the intuition behind these regularisation functions and their properties and even see some mathematical proofs of how they hold true.
How many features are needed for humans to predict price of a house?

All regularisation techniques work in a way to reduce dependency on too many variables. Going back to the classical housing problem, the input factors or variables are around 80. We know that using all 80 features to predict house pricing is an overkill. As humans we would at best look at 10–20 factors to come up with a price estimate. The regularization does exactly that same — tries to fit the observed samples to the curve but makes the curve function dependent on lesser number of variables. As before, we shall use linear regression example to understand this better.
Ridge Regularisation
Easiest way to achieve this is to meddle with the cost function. Remember that in the previous article, we learnt that L₂ norm was probably the best choice as a cost function due to both its inclusive nature and differentiability. So lets recollect how the L₂ norm cost function looks like:

m refers to the total number of observations we have. Also recollect that h(x) is the linear function based on the various input factors x.

Now we want the curve to be influenced by as few factors as possible without the error shooting up. So we could modify the cost function, referred to as the Ridge cost function, as follows:

At this juncture, a lot of you might also recall the L₂ norm nature of the new summation term that we saw in our previous article. What this would try to do is to reduce the weights or coefficients of xⱼ to as low as possible and in the process reducing the influence of a lot of these variables. The higher the value of λ, the greater the focus on regularization.
Another way to look at the problem is to minimize the following cost

subject to the following criteria (Ridge function)

In other words there is a cap on the values the coefficients take through the above term.
An interesting question arises as to whether this would reduce the impact of irrelevant factors or completely eliminate the irrelevant variables. In order to answer this, I would like to also introduce another regularization technique and the contrast, as you shall see, will throw better light on this problem.
Lasso Regularisation

Referred rather cryptically as Lasso (“least absolute shrinkage and selection operator”), this regularization technique modifies the cost function as follows:

As you can see, the difference between Ridge and Lasso is the difference between L2-norm and L1-norm.
Again the problem can be rephrased as minimizing the following cost

subject to the following criteria (Lasso function)

Which one is better?
Turns out that Lasso as the name implies is a selection operator. So it is better in terms of reducing the dependency on too many factors and zeroing in on the most important signals. In fact while Ridge function reduces the coefficients of the irrelevant signals, Lasso zeroes them out. How does this happen — let us try to see the mathematics behind it.
Visualisations of the Lasso and Ridge functions
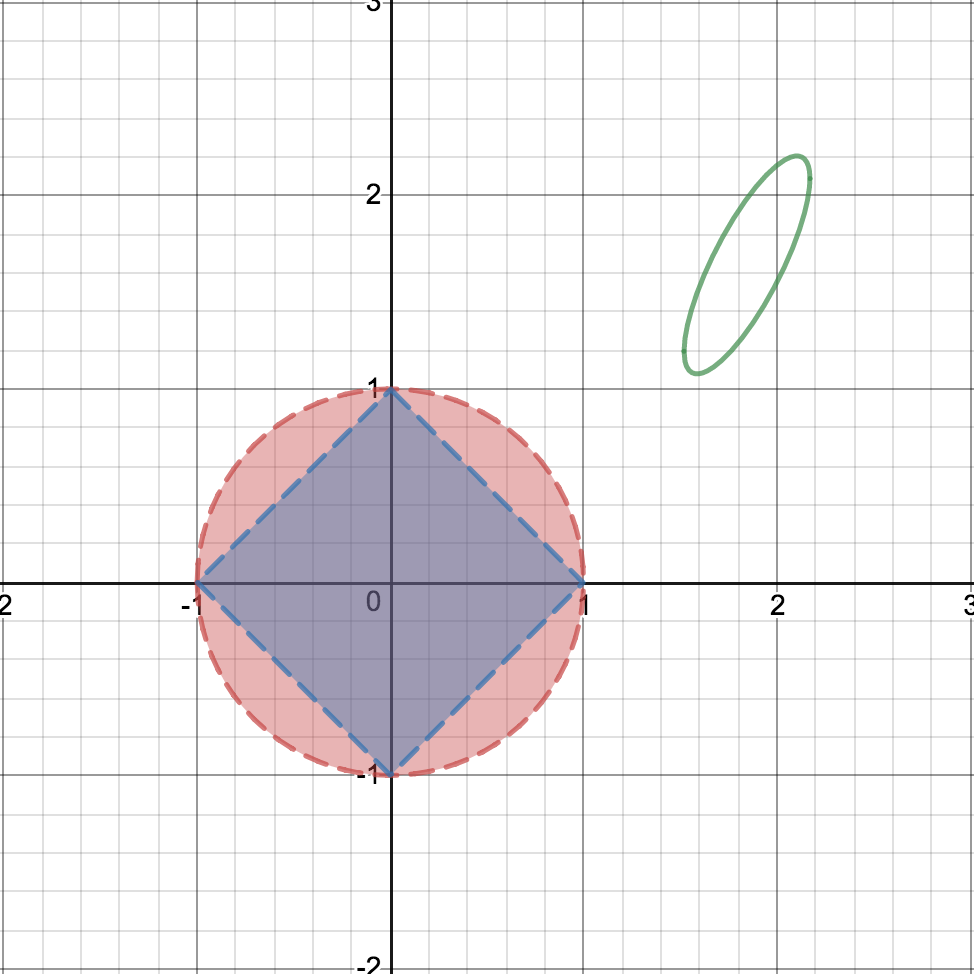
Let us first plot these functions to visualise them better. Assume that there are only two parameters w1 and w2.
The Ridge function appears as the area enclosed by a circle, while the Lasso function appears as the area enclosed by a diamond. To recall, the Ridge function is the following:
which in this case(two variables) is

r turns out to be the radius of the Ridge circle.
The Lasso function is the following formula:

In our case for two variables the Lasso plot is based on the following function:

The geometry of these two functions, as we shall see, plays a major role in their feature selection ability.
At this juncture it is important to note that the points of intersection of the circle and diamond with the axes are the points that cause feature selection.
Contours of the cost function
Let us now plot the contours of the cost function — the points (w1, w2) sharing the same cost.
The green ellipse is the contour of the cost function for a particular value of the cost. The cost function, for recollection, is the following:

By definition of the contour, all points in the boundary of the ellipse will have the same value of the cost.
At higher cost values, the contour ellipse will sort of expand and move towards the Ridge / Lasso function. The intersection of the contour ellipse with Ridge / Lasso function will be the lowest cost value that satisfies the Ridge / Lasso criteria.
Feature selection — An animation
Please take a minute to watch the following video and see how the contour intersects with the Ridge and Lasso plots.
[youtube https://www.youtube.com/watch?v=XJ8MyaiA6I8]
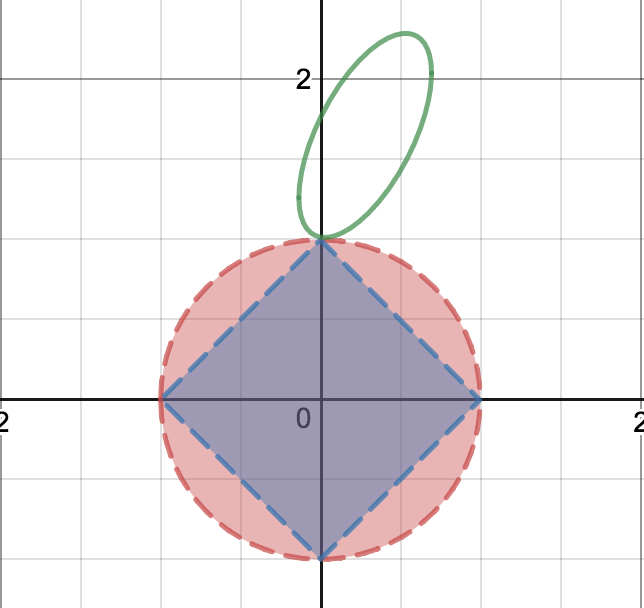
As the video shows, the contour touches the Ridge circle at a point outside the axis. However the contour touches the Lasso diamond at the axes causing feature selection to happen!
That now takes us to the question — is my video of the intersection just a “rigged use case” to highlight feature selection of Lasso? How probable is this?
How often does Lasso do feature selection?
Suppose a random elliptical contour function has a probability p of touching the Ridge circle at a particular axis at a tangent.
Let probability of ellipse tangential to Ridge circle be “p”
This indicates that the Ridge function has done feature selection. In other words let the feature selection probability (P_r) of Ridge function be p.
Going by the geometry of the Lasso function, the feature selection probability (P_l) of Lasso function
P_l > P_r => P_l > p
(The Lasso square lies entirely within Ridge circle, so the ellipse tangential to circle will be tangential to the square as well)
Let us consider ellipses that intersect the Ridge circle at the axis but are not tangential.
Elliptical countours that intersect at the axes
The probability of an elliptical contour intersecting in a non-tangential manner with Ridge circle = (1 – p)
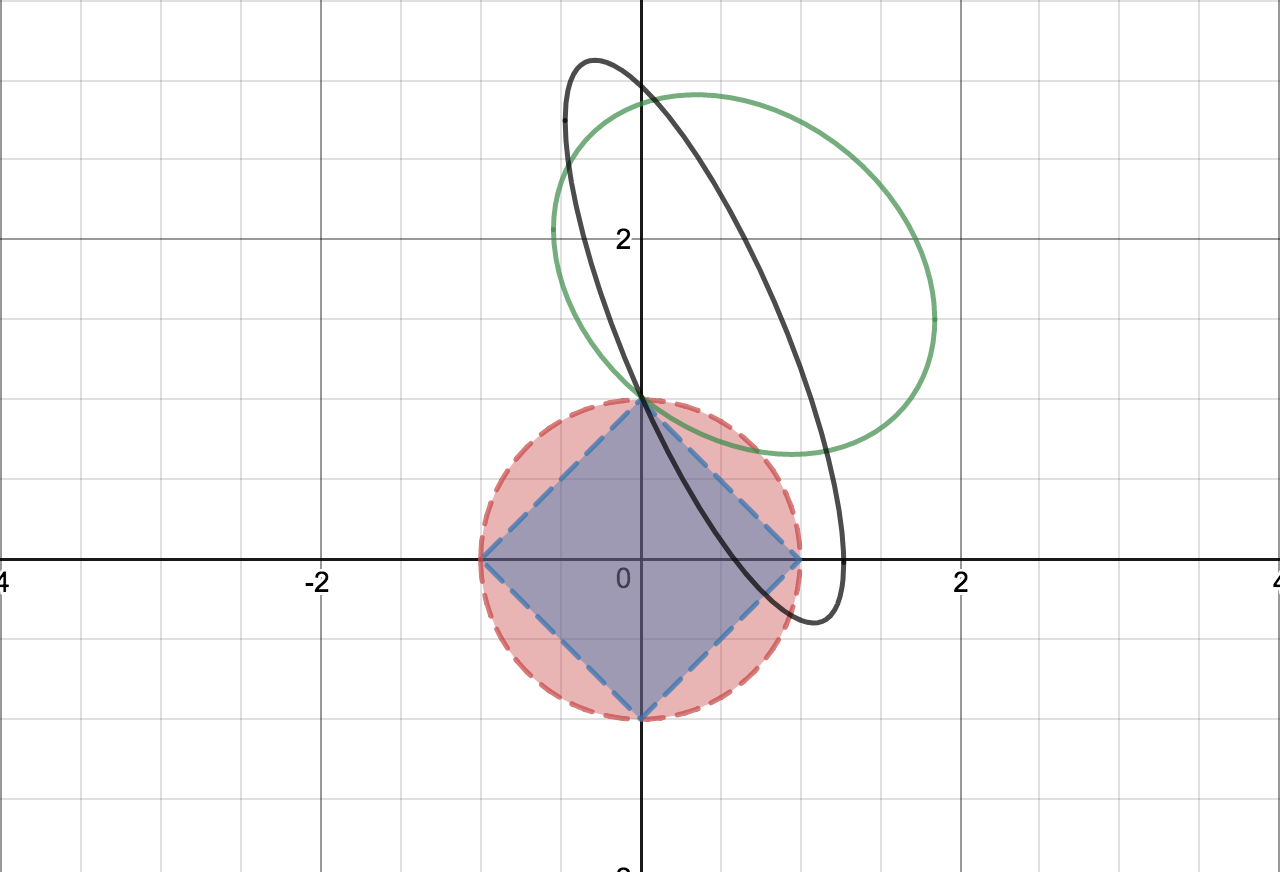
Note that the non-tangential ellipse could intersect either like the green ellipse in the figure above or the black ellipse.
The green ellipse is still a tangent to the Lasso square, but the black ellipse is not! This means in addition to p, Lasso has an extra probability coming from such ellipses. So the question is the following:
What is the probability of the ellipse be a tangent to the square but non-tangential to the Ridge circle?
That depends on whether any portion of the ellipse falls within the blue region or not.
The area of the blue region is given by

since the blue region is composed of 4 right angled triangles around the origin.
The area of the circle is given by
![]()
The probability of a portion of a random ellipse falling within the blue region is given by

which is equal to
![]()
which is roughly 0.6366
This means that the probability of the intersecting non-tangential ellipse to the Ridge circle being a tangent to the Lasso square is = 1–0.6366 = 0.3634
P_l = p + 0.3634 * (1 -p)
This means that even when p is zero, P_l is 0.3634. In other words the Lasso approach is guaranteed to do feature selection in 36% of the cases at the very minimum!
So given Lasso and Ridge are L-p norms, the learnings can be more generalized. We see that the Ridge is more conservative than Lasso when it comes to dropping features. As p decreases, feature selection happens — the lesser important features start getting dropped. Also want to mention that there are techniques such as Elastic Net that try to balance between the two, the details of which I will not get into in this article.
Now having learnt Lasso, we cannot stop wondering if only we could arm the poor Suppandi with a Lasso feature selector and help him avoid those embarrassments in his apply phase. Alas, then India would have lost not only a childhood comic hero but also someone who taught us all in our early days of our life about the need for regularization while we learn through his mistakes! Suppandi, by making himself the object of ridicule, was after all our teacher.