

Data is making its way across all industries and verticals today, becoming one of the must-haves for organisations on their way to success. In the current economic climate, organisations need to take advantage of all the available data resources to stay on the right track by basing their decisions on thorough analysis. Data plays a different role depending on the industries, and depending on their product/ service offerings, organisations tend to vary the amount of data-driven usage in the company.
In the CPG industry, utilising data in the overall business strategy is the real key to staying ahead of the competition and creating a cycle of continuous growth. The nature of CGP is volatile in context to changing consumer demands and market trends. Data science allows organisations to leverage consumer and organisational data. It offers approaches to identify insights, forecast trends and make informed business decisions based on data-driven predictions.
Data scientists tend to lack the in-depth knowledge in statistics that could further their insight generation. Statistical tools are essential for data analysis. This is especially true when it comes to industries like CPG that are so volatile to external factors. They allow organisations to utilise quantitative methods to test data-driven theories in a real-life scenario. The latest AI-based techniques and predictive economic modelling tools help organisations systematically identify the economic factors that can influence their business decisions. This combination of data with the quantitative application of statistical and mathematical models helps data scientists to test existing hypotheses and forecast future trends.
Data scientists in CPG industries can easily adapt econometrics, given their deep understanding of the maths behind linear regression or panel data analysis techniques. For instance, CPG organisation leaders can use econometrics to optimise the promotional spend and ROI for a market and use econometric & statistical tools to quantify the relationship and draw conclusions.
There are four broad categories of statistical tools that can be used, depending on the organisation’s use case, their product/service offerings, and the kind of insight they aim to derive from their data. Depending upon their use case, data scientists can choose among the four tools or combine them for better results. Let’s look at these tools in some detail.
Descriptive Statistics
Descriptive statistics essentially entails the measure of central tendency and dispersion. The tool measures central tendency, dispersion and distribution of data using statistical techniques.
Data scientists can use this tool for summarising and describing their dataset and enhance their exploratory data analysis by describing the characteristics of the data. Descriptive statistics is important because it helps data scientists understand the data they are dealing with in a comprehensive manner. Getting information about the variables involved and the potential relationships between those variables is the first step in using the data for analysis.
Central tendency assists data scientists in measuring the median values of a dataset, thereby helping them navigate the central location of data to focus on. Descriptive statistics is further used to calculate the measure of the dispersion of variables in the dataset regarding the centrally found values. This can be done through Range, Interquartile Range (IQR), Standard Deviation, Variance, Mean Absolute Deviation, Coefficient of Variation, Gini Coefficient, etc.
Lastly, the methods can be summed up using statistical distribution to calculate the probability of an occurrence happening again.
The CPG industry can be easily affected by something as immediate & small as a weekend storm that prevents consumers from shopping. Descriptive statistics helps companies use past data and make future insights in a timely manner. CPG manufacturers can leverage their historic data to understand the shopper’s experiences and use the information to create real-time insights. For instance, let’s take the COVID-19 pandemic crisis and the fluctuating demand for sanitisers. Studying the economic data can highlight the potential relationship between new COVID-19 waves and the demand for sanitisers; CPG analysts can predict the rise or fall in demand and manufacture sanitisers accordingly.
Regressions
Along with the descriptive analysis, data scientists can use regression analysis to investigate the relationship between the dependent and independent variable(s). In CPG, the technique is best used to find the causal effect between the variables. For instance, taking the sanitiser example, data scientists can use regression techniques to determine the relationship between the rise of COVID-19 cases and the demand for sanitisers.
Linear Regression techniques are used to quantify the relationship between several variables and adjust for confounding effects. Data scientists can opt for simple or multiple linear regression depending on the nature and count of explanatory variables involved in the problem. The regularisation techniques such as lasso, ridge or elastic net can complement the analysis in the case of a huge set of predictor variables.
Another recommended regression technique is the Panel Data Model to model time series data and forecast time-dependent observations. It provides multidimensional data related to an observation that has been measured repeatedly over a span of time. This could include variables such as individuals, product choices, city, household items, etc.
Essentially, it provides information on the difference in variables across individuals- over a period of time. The panel data model uses techniques such as Pooled OLS, fixed-effects model and the random-effects model.
Forecasting
One of the most predominant use cases of statistical tools is forecasting. Forecasting market trends and consumer demands is the basis of CPG, and it is important to correctly identify these for better business ROI.
Benchmark forecasting is a technique used to build the forecasting intuition that can be used as a baseline for additional complex layers. Benchmark forecasting entails techniques such as Drift, Naive, Seasonal, Mean, Seasonal naive, Random walk, Linear trend, and Geometric random walk.
Intelligent forecasting is a critical tool for data scientists, given its adaptive nature. While generic modelling tools are built keeping the industry in mind, forecasting tools can completely adapt to the company’s needs. They intake the company’s historical data as dependent variables within the model, allowing the following indicators to be extremely company-specific.
It is important to note that a one-size-fits-all approach to forecasting does not work for CPG and retail businesses. Instead, leaders and data scientists should build a category, region, or product-specific forecasting method. The model’s ability to customise, add, or change easily allows it to become flexible to ensure accuracy is maintained across the various aspects of the business planning process for CPG.
For instance, data scientists can use historical data of the supply chain problems when the petrol prices have been hiked up. They can use this to forecast when the next petrol price hike would occur and its impact on the supply chain. They can then use this information to prepare in advance.
Hypothesis Testing
So you have understood your data, and you have made hypothetical predictions based on the data. The next tool is to ensure that your predictions are correct and that the manufacturers can go ahead with them.
Hypothesis testing is an effective statistical tool to assist data scientists in gaining supporting material for their findings and conclusions. The tool focuses on measuring claims against accepted facts about the whole population. Measures such as the p-value can support or reject the claims or confidence intervals to measure the degree of uncertainty. In addition, CPG focused data scientists can utilise hypothesis testing to verify how probable the detected consumer behaviour is.
They can do so using several methods, such as
- The t-test
- Anova
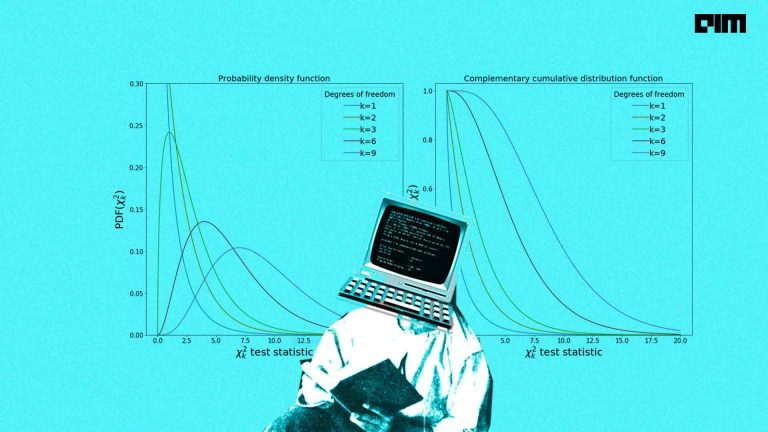
- Chi-square test
For instance, data scientists working in a clothing retailer have drawn the hypothesis that the sale of tank tops is high during summer among girls between the ages of 15-30. Data scientists will use hypothesis testing tools like the t-test to test and prove this hypothesis.
As you would have noticed, these tools don’t act independently. This is why they help data scientists in creating a holistic view of industrial data and its impact on economics. The interconnectedness of econometric tools with data analytics is essential for data scientists to consider while working on CPG and FMCG applications. The implementation of statistical modelling for forecasting and price analysis in CPG is a critical phenomenon in the growing future of data science.
The views, thoughts, and opinions expressed in this article belong solely to the author and does not reflect the views and opinion of the author’s employer, any other organizations, committee or other group or individual. This article is written by a member of the AIM Leaders Council. AIM Leaders Council is an invitation-only forum of senior executives in the Data Science and Analytics industry. To check if you are eligible for a membership, please fill the form here.