“The art and practice of visualizing data is becoming ever more important in bridging the human-computer gap to mediate analytical insight in a meaningful way.” This statement by tech visionary Edd Dumbill summarises the ease with which graph analytics come in for solutions.
All businesses, big or small, deal with data. Now, innovative ways are being explored to discover easy ways to make sense of this data. And graph analytics is one of the leading techniques that can bring meaningful insights into an organisation’s data analytics setup. They are used everywhere in applications ranging from data centre management to recommendation engines.
Why Graph Analytics?
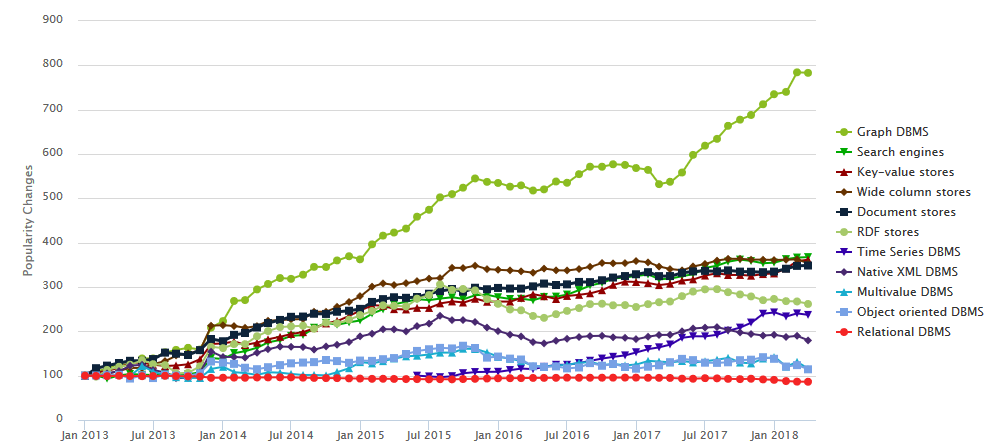
Graph analytics has become more and more popular because of the ease with which new sources of data can be added and new relationships between data can be attained. Here are its advantages:
Timesaving: In contrast to other data analytics techniques, it takes much less time in organising the data, and fewer efforts in adding more data sources. Traditional analytics methods mainly just report data and it takes a lot of efforts to get insights from the data. But graph analytics can do this job easily and quickly.
Easy to work with: Other techniques join different datasets one by one and then finally come up with a result which combines them all. Graph analytics uses all the data at once and merges it to give meaningful information. It is an easier way to model, store, retrieve and analyse data.
Visualisation: The visuals of graphs are appealing and easy to catch an eye, compared to the other analytics techniques which may not be quick to understand. They are good with expressing large, complex data in such a way that all the necessary information can be squeezed into one representation to the viewer, in no time. Attractive visualisations are definitely a plus for graph analytics.
Solve complex problems: Other analytics methods try to find answers to known questions, like what is the best product for the business or who are the most important customers. Graph analytics, apart from these direct questions, can also find answers to some of the indirect questions, like the operational risks in a business. It comes with an ease to add data and obtain relationships out of them, making it effortless to serve answers to such questions as well.
Use Cases
Many tech giants like Google and Facebook are making use of graph analytics in their functioning.
Sub-graph isomorphism, a graph analytics technique, consists of a problem in which two graphs are given inputs and it has to be determined whether one of them has a subgraph that is isomorphic to the other one. It has had a use in chemoinformatics to find similarities between chemical compounds from their structural formula.

Google is using graph analytics since a very long time, through Knowledge Graph for recommendations in its search engines. It uses an algorithm called Random Walk with Restart (RWR) which explores the global structure of the network to estimate the proximity between two nodes.
Centrality analysis is a technique used as indicators of centrality identifying the most important vertices within a graph. There are different types of centralities like betweenness, eigenvector, degree, harmonic and Katz centrality. For example, this technique can be used to find out the most influential person on a particular social network.
Graph algorithms can be very effectively used in social media data analysis, Twitter and Facebook do not lag behind in making complete use of graph analytics. Algorithms of Page rank and RWR are used by Twitter. Graph analytics can also be used in detecting fraud social media accounts.
eBay uses Knowledge Graph to know about shopping behaviour patterns of people and bridge the gap between structures query and behaviour data. Graph analytics here helps to follow up on the questions to ask in order to find the best results in the shortest possible time.
Oracle’s Spatial and Graph, Microsoft’s Graph Engine, Amazon’s Neptune, SAP’s HANA, IBM’s Compose for JanusGraph are some of the key players in this demanding area of graph analytics.
Why Should You Consider Incorporating
This powerful analytics tool of graph analytics can be used in many tasks in your organisation’s analytics team like in risk management, relationship analysis and to identify new business opportunities. Graph analytics can provide insights into the data and their relations so intuitively, and that it is why it is crucial that businesses adapt to use this tool and leverage the best advantage of it.