


You are trying to purchase your favourite T-shirt from a popular online store. Just as you click on the “Add to cart” button following screen pops up

Looks familiar?
Many of us might have encountered this kind of an error while browsing the internet, trying to load an application or maybe making a purchase from a website. So, what just happened here. Minor network glitch or is it something bigger? In some cases, such minor network issues might not seem minor at all but could be caused by an application that is facing performance degradation issues or in other words failed to load.
Application or server failure can be caused by network issues, excess memory consumption, hardware/software outages and other causes. The effect of this in sectors such as healthcare, financial services or even e-commerce as mentioned in the example above can be devastating, It can cause companies to lose millions and result in huge financial losses.
Hence, there is merit in trying to predict when an application or a server will fail or might degrade in performance to pre-empt and prevent such losses.
Use case:
Building on from the previous example, when you want to buy a product in one of the popular online merchant sites and you get an error message as above you will not be able to place your order at that point. This is only from the perspective of a single user, now multiply this across all users coveting that particular model and not being able to place the order. That would amount to a huge loss to the merchant as well as the company trying to sell the product.
But, do you see such errors happening often- the answer is probably ‘No’. Hence though from a user perspective the effect might have minimal impact from the perspective of a business it might mean an impact of a million of dollars. Hence, our business use case here is to predict when such failures might occur and since these failures are few and far between our task becomes even more complicated.
The problem or the use case can be split into 2 parts:
1. Find out what are those anomalous patterns/sequence of events vs the normal patterns
2. Which of these anomalous patterns will lead to failure of the application (Eg: a webpage)
Today, I will illustrate the first part of the problem and this will be our agenda:
- Problem statement
- Sample data
- Brief about Apriori algorithm
- Our approach
- Practical demonstration using Python
1. Problem statement
Application failure can occur due to server failure where the application is hosted, network error or anywhere in the application infrastructure. Hence our input data will be all the related log files of the servers, application logs, user logs -basically any logs that might help to indicate there is something amiss in the application performance. I will not go into the details of what are the different data sources, but one common source can be the application monitoring systems. What we need to do is find out from the logs all the critical and non-critical error codes and warnings.
We will be using Apriori algorithm to find out the associations or patterns between these errors and warnings.
Pattern recognition can be done using labelled training data, but in many cases, the training data might not be labelled. In this case, we need to use unsupervised learning methods to recognize patterns/sequences and then assign them a label. While it is not always essential to assign a label, what pattern recognition aims to do is find out what are the most frequent patterns. Typically, this has been the most common usage of this type of pattern recognition; like for example in market basket analysis where we try to find what are the goods most frequently bought together. We will be using a similar approach here.
2. Sample dataset
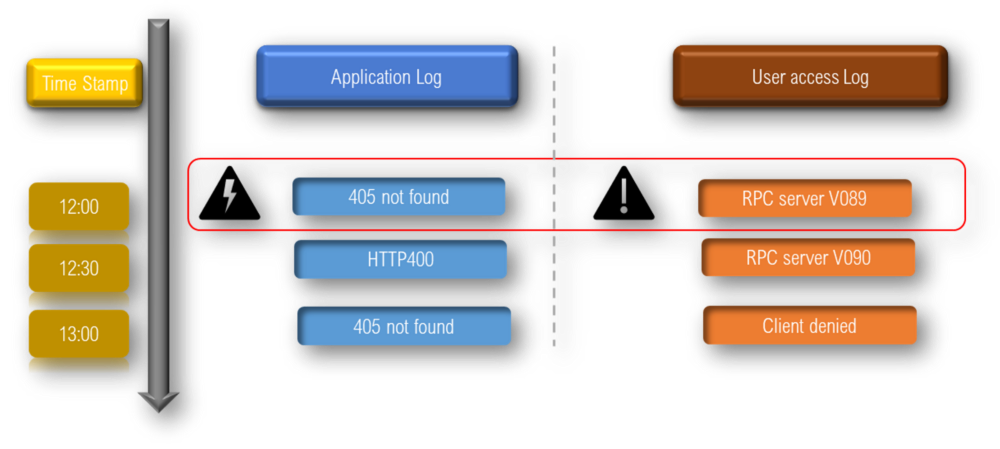
The data sample with error codes can look like Table 1 below. At an interval of 1 hour we will extract all the relevant error codes from different log files and stack them.

3. Illustrative e-commerce web application flow
Let us consider the following web-application flow as an illustration:

In this case, when a user sends a request inquiring about saying the price of a product or he wants to check out and buy the product, the response is sent to WAN search and then through a firewall which is connected to load balancers to different web servers and E-commerce nodes. This in turn connects to a database which houses all the product information.
The query then looks up the relevant details in the DB and sends the response back to the user. In this process, if anything breaks in between like the e-commerce node fail or the web server fails, the user/customer will not get the response. So, you can imagine, this means there could be one less product that was purchased for the merchant.
4. Our Approach
The solution will be split into 2 sections-
Section I: Creation of the list of error patterns that are associated together
Section II: Use anomaly detection for failure prediction
Section I: Creation of the list of error patterns that are associated together
a) Refresher of Apriori algorithm
Apriori algorithms work on the principle of generating most frequent itemset in a transaction. Here each row (as illustrated in Table 1) will be considered as a transaction.
The anti-monotonicity of the support metric is a key concept here and following is the assumption:
All subsets of a frequent itemset must be frequent
If an itemset is infrequent, all its supersets will be infrequent.
Typically, 3 metrics are used to understand the strength of association. We will discuss this below:
a) Support: This is the measure that provides a view on how frequent an itemset is in all the transactions. Formally we can define support as follows:

In our example, Support for {HTTP400, link_failed} = 4/24 i.e 0.17
b) Confidence: This is the measure of the occurrence of a consequent given the antecedent. In our example consequent is {X,Y} and antecedent is {X}. Hence formally it can be defined as:

In our example, Confidence for {HTTP400, link_failed} = 4/5 i.e 0.8
c) Lift: Lift is a measure of performance of the association rules and defined as:

In our example, Lift for {HTTP400, link_failed} = 0.8/ 0.25 = 3.2
We will be creating the rules using the apriori algorithm and then evaluate using the metrics mentioned above.
b) Practical demonstration of Apriori algorithm in Python
Sample dataset was illustrated in Part 1. You can get the sample dataset and the code in Github (https://github.com/Mythili7/Failure-Prediction)
First start with importing the necessary libraries and the dataset We will use the ‘apyori’ library here.
We will consider maximum 2 associations in a rule for the sake of simplicity:

Next let’s train the apriori model and get the association rules:

The rules will be displayed in a format that is not easily readable as shown below:

Oops! Difficult to comprehend right? But thankfully there is a work around to this.
You can easily create a dataframe and display the rules in a structured format using indexing.

Now this is much easier to read and analyse right?

The association rules are already sorted by the highest lift. As you can see error ‘405 not found’ often happens in conjunction with ‘RPC server V089’ error with a very good lift of 24. In our case this means, at the same point in time, there was an error in the web server which is showing up in 2 or more log files.
Now that we have got the list of errors that frequently occur together, how do we know which of these rules is a ‘blocking error combination’. A blocking error combination is more likely to give rise to the failure of a web application as opposed to a non-blocking combination. See the Fig 2 below:
In other words, a blocking error combination is an anomaly while a non-blocking error combination might be just a warning or a non-fatal condition.
This brings us to Section II of our solution.
Section II: Use Iforest algorithm to find out which association rules are anomalous
a) What is anomaly detection
Consider the following diagram:

In a 2D space, let’s say we have 2 features X1 and X2 and we plot few observations. As you can see, we can see 2 clusters which exhibit normal behaviour while the red dots which are further away from the clusters are the anomalies. In other words, the distribution of the red observations differs significantly from the majority of observations. This is the basis of anomaly detection, which is what we will utilize in our approach.
b) Brief about isolation forest algorithm
Isolation forest is an algorithm that works by isolating the anomalous data points.
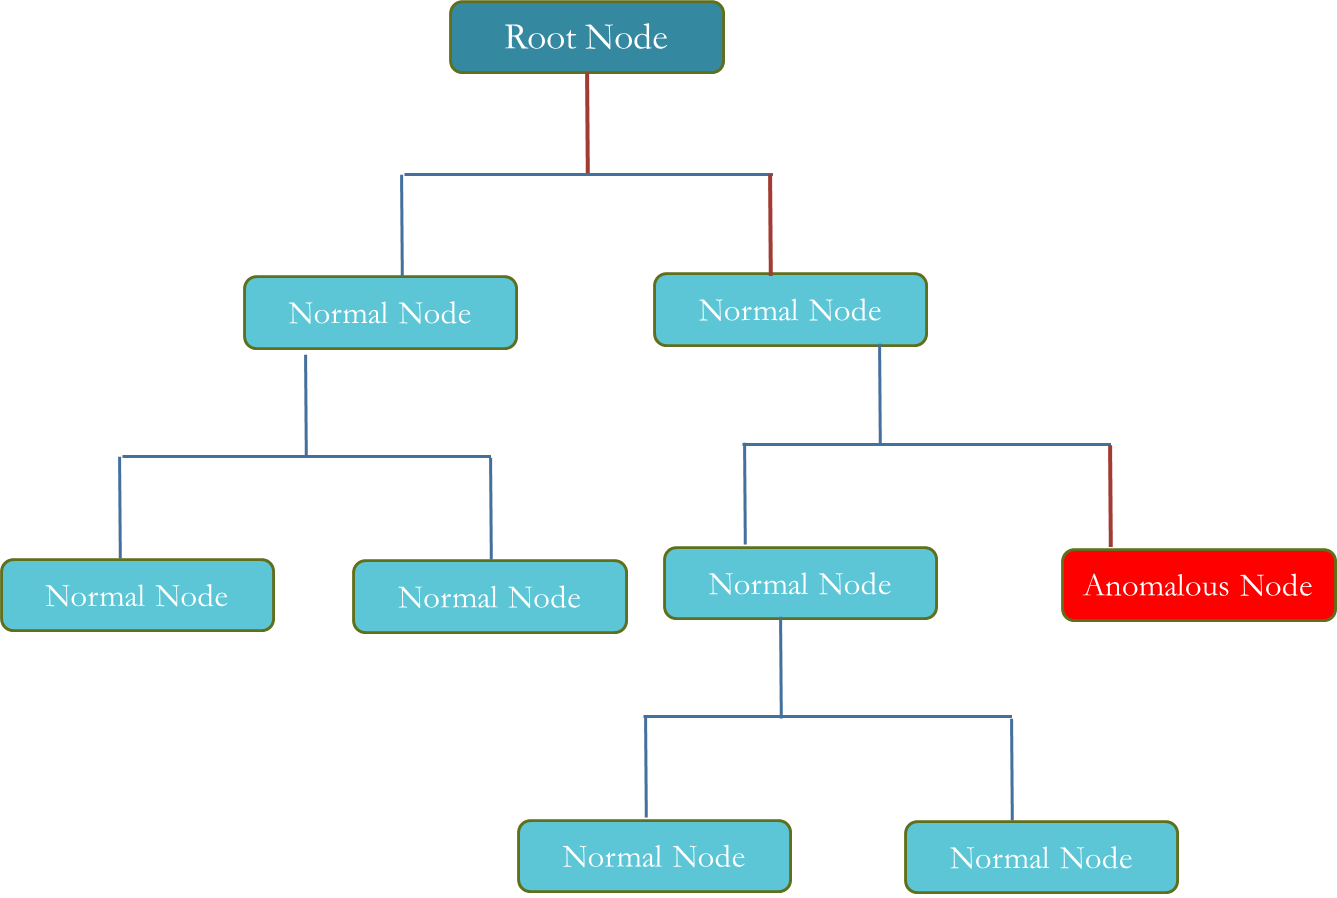
By randomly selecting a variable/feature the algorithm recursively creates partitions of the data. We need to look at the path length of the trees that will be generated and the anomalous points will be the ones with shorter path length than the normal ones. Path length is defined as the path traversed from root node as given in the figure below:
We will be using the Isolation forest algorithm, to detect those association rules/patterns that we identified in Section 1 to separate out the anomalous rules. The anomalous rules will indicate that if we observe a similar pattern in the log files at any point in time, then this will lead to a failure.
c) Iforest in python for Failure prediction
Partition the dataset with only the association rules

You would get an output like this:

We will now use these association rules that was obtained in Section 1 as features of the Iforest model to predict the failure of the web-application.In this case, we will see that the anomalous error patterns/rules will be the ones that will give rise to failure/performance degradation of the application.
Transform the data into categorical 1/0 values and then train the Iforest model.

Let’s look at the results:
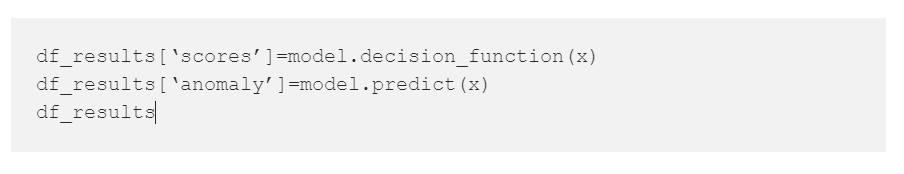

The highlighted rule with an anomalous score of -1 is the rule that is likely to give rise to a failure.
Conclusion
We discussed today how we can detect the failure of a web application by taking 2 examples log files relevant for our eCommerce use case. For other applications, we first need to understand the underlying server and other connections that affect the application and consider those log files. The important step is to extract the relevant information from the log files and then structure it accordingly and then apply the approach that was discussed.
Do let me your feedback in the comments and reach out to me in case of any questions.
References:
- B Mohammed, I Awan, H Ugail, M Younas, Failure prediction using machine learning in a virtualised HPC system and application, Springer (2019)
- A Bala, I Chana, Intelligent failure prediction models for scientific workflows, Elsevier(2015)
- Fei Tony Liu; Kai Ming Ting; Zhi-Hua Zhou, Isolation Forest, IEEE(2009)
- Rakesh Agrawal and Ramakrishnan Srikant, Fast algorithms for mining association rules.,VLDB, September 1994.


