
5 min
Consider this price and sales table for four cities:
 With this visualization, our client discovered a number of insights in calling pattern behavior of their customer segments. For example, the share of rural traffic rises on Sundays, mainly because urban traffic falls while rural traffic is unaffected. It also made it possible for them to identify specific days on which their competitors' call volumes shot up, and helped them identify which competitor's campaigns were proving effective against them.
[divider top="1"]
Here's a visualization of the social network of geeks across different cities in India. An interactive version of this is available at http://gramener.com/codersearch. We built this to identify who would be a good candidate to hire, as well as decide which city is the best hunting ground for geeks.
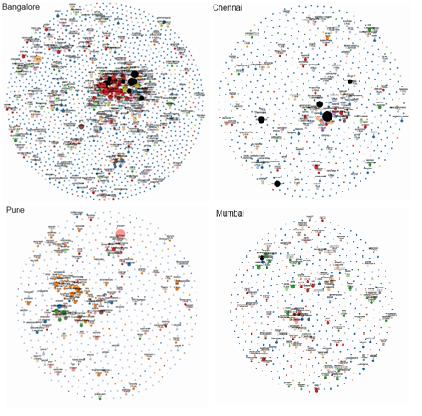 Each circle represents a developer. The size indicates the number of followers they have on Github. The color indicates the language they code in. Networks of followers are connected by lines and clustered together.
This is an instance of transforming relatively unstructured data into quantitative metrics (distance between a pair of people; density of a network; etc) and displaying them purely visually, without any numbers. As a result, it conveys far more richness and meaning intuitively to the viewers.
[divider top="1"]
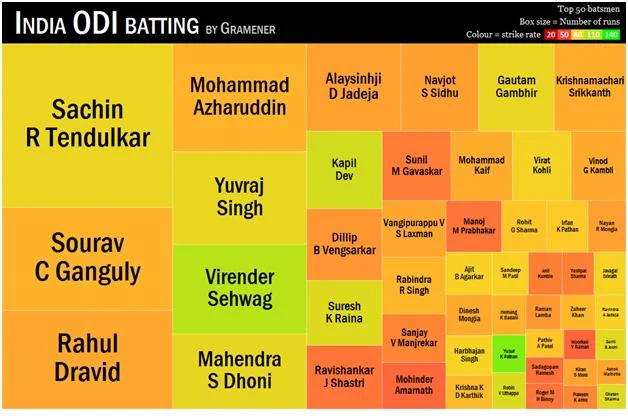
Another instance is this visualization of the entire history of batting in Indian one-day cricket. The size of the box represents the number of runs scored by the player. The color indicates the speed at which they scored those runs (red is slow, green is fast.)
 It's evident that among the big scorers, Sehwag is India's fastest run-getter. Clicking on the players shows an second drill-down featuring every match they've played. An interactive version of this is available at http://gramener.com/cricket/batting-India-plain
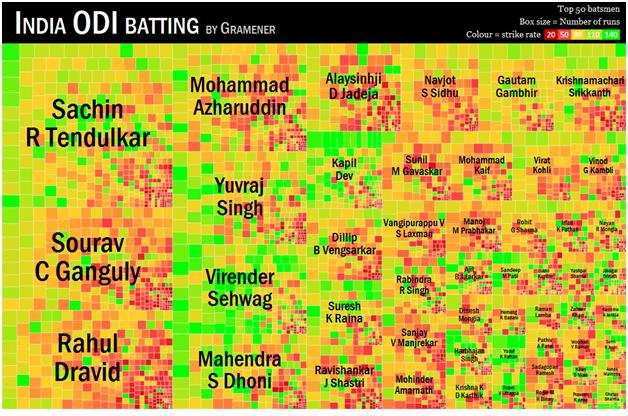 This compresses over 150 pages of information into a single sheet without any loss. Part of the power of data visualization comes in this ability to compress information and compactly convey insights.
[divider top="1"]
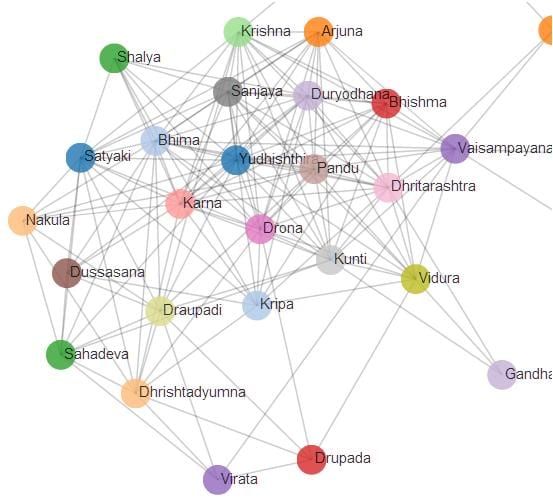
We're moving into visualizations of non-quantitative data. There's a lot more text out there than numbers, and it's possible to mine information from that. For example, even a pure-text corpus like the Mahabharata lends itself to social network analysis.
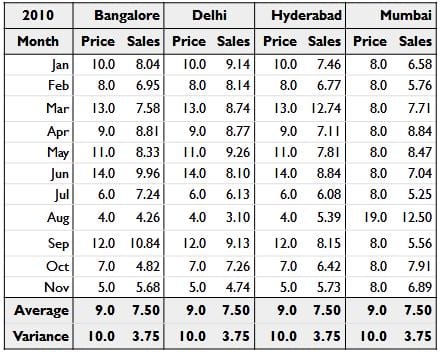
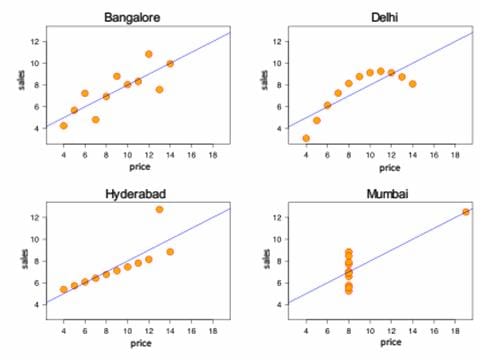
- The four cities are completely different in behavior and need different strategies for growth.
- That Delhi is price sensitive, while Bangalore and Hyderabad are not
- There is at least 1 data point each at Hyderabad and Mumbai that look like aberrations
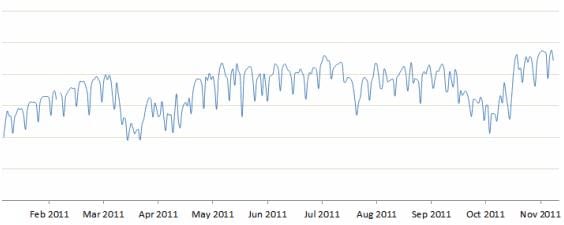
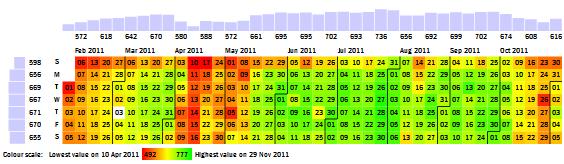 We were working with a leading mobile operator who provided us with minutes-of-usage data. We plotted this time-series on a calendar, creating the Calendar Map you see above. Red cells show days with lower usage, and green cells show days with higher usage.
With this visualization, our client discovered a number of insights in calling pattern behavior of their customer segments. For example, the share of rural traffic rises on Sundays, mainly because urban traffic falls while rural traffic is unaffected. It also made it possible for them to identify specific days on which their competitors' call volumes shot up, and helped them identify which competitor's campaigns were proving effective against them.
[divider top="1"]
Here's a visualization of the social network of geeks across different cities in India. An interactive version of this is available at http://gramener.com/codersearch. We built this to identify who would be a good candidate to hire, as well as decide which city is the best hunting ground for geeks.
Each circle represents a developer. The size indicates the number of followers they have on Github. The color indicates the language they code in. Networks of followers are connected by lines and clustered together.
This is an instance of transforming relatively unstructured data into quantitative metrics (distance between a pair of people; density of a network; etc) and displaying them purely visually, without any numbers. As a result, it conveys far more richness and meaning intuitively to the viewers.
[divider top="1"]
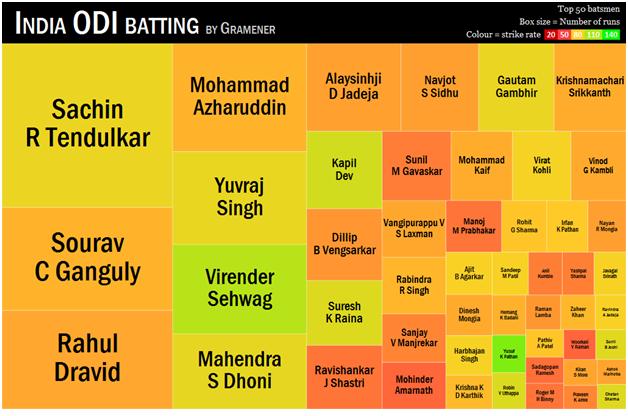
Another instance is this visualization of the entire history of batting in Indian one-day cricket. The size of the box represents the number of runs scored by the player. The color indicates the speed at which they scored those runs (red is slow, green is fast.)
It's evident that among the big scorers, Sehwag is India's fastest run-getter. Clicking on the players shows an second drill-down featuring every match they've played. An interactive version of this is available at http://gramener.com/cricket/batting-India-plain
This compresses over 150 pages of information into a single sheet without any loss. Part of the power of data visualization comes in this ability to compress information and compactly convey insights.
[divider top="1"]
We're moving into visualizations of non-quantitative data. There's a lot more text out there than numbers, and it's possible to mine information from that. For example, even a pure-text corpus like the Mahabharata lends itself to social network analysis.

Your reaction
Discussion
What's your take on this story?
No comments yet — be the first to share your view.