We hope to answer the following key questions in this case study
- What does Loyalty card do for a retailer which they cannot observe from a basket or invoice level details?
- How to measure the success of a loyalty program?
- What can the loyalty data be mined for?
- What are various ways the data can be mined?
Background
A typical Customer goes through 5 stages in their Lifecycle as shown in the diagram below
 At every stage, analytics can be used as an aid to take key decisions for
- Right Prospect / Customer – based on estimates of Lifetime Profitability
- Right Channel – based on estimates of response rates & ROI
- Right Message – based on resonance with target customer group
- Right Offer /Promo – based on estimated response rates & ROI
This whole process is generally described as Customer Driven Marketing. At its essence is using available data about customer’s transactions, demographics & other characteristics, to segment target and personalize the organization’s marketing efforts.
Customer loyalty systems – a goldmine of customer information
The data, to be used for customer driven marketing, is usually taken from the retailers Loyalty Management System. Most retailers today have adopted such a system, which is extensively used for reward point accumulation & redemption. Shopper’s had led the way with their First Citizen initiative and now most large departmental stores have a well established customer loyalty program, notable being The Landmark Group’s The Inner Circle and Trent’s Clubwest programs.
The initial intention of loyalty programs was to act as an additional incentive to the customer, to increase her purchase levels. Over time as organizations kept accumulating data on purchase patterns at customer level over time, they realised the potential of the underlying data to unlock value. The purchase patterns inherent in the data would reveal the true preferences of a customer, which has enormous advantages over data collected through a survey.
- Customers may hide their true preferences in a survey
- A survey can be done only on a very small section of the customer population
- The survey needs to be pre-designed and hence the retailer needs to have some pre conceived hypotheses, that they validate/invalidate
- The cost of fielding/collating results from a survey is high
Transaction data suffers from none of the above drawbacks, plus since the system is already in place for operational reasons, leveraging it for data analysis is a marginal increase in cost.
- Retailer can learn demographic based preferences of its customer base
- A retailer can predict the next best items to stock based on previous purchase behaviour
- Ability to upsell and cross sell at POS becomes lot more effective
- Ability to target prospect base with a focused approach rather than one size fits all
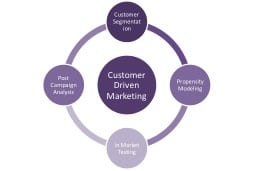
Customer Lifecycle Management typically follows a 4 step closed loop approach, as shown below, and the basis for it all is Customer Segmentation, which acts as the foundation for the entire structure
 TESCO, was the worldwide trendsetter in utilizing customer loyalty data to increasing ROI of marketing efforts. Starting in the mid 90’s, with help from the retail consultants Dunnhumby, they have used their Clubcard data to refine a range of marketing activity
- Personalising quarterly point redemption offers, based on purchase preferences of the individual customer
- Deciding on product placement within stores, based on complementary products
- Segmentation of customer base, based on loyalty (RFM) and purchase patterns
- Customising assortment in stores based on customer segment make up in the catchment areas etc
Indian retailers have also woken up to the value of the data at their disposal and are looking for ways and means to monetize it. The subsequent pages shall talk about a case of using customer loyalty data to refine direct marketing strategy.
Business brief
Our client, a leading apparel & lifestyle good retailer, which is part of a large Indian conglomerate. The retail business has been in operation for over 5 years, and the client has over 30 stores all across India.
The client introduced a customer loyalty scheme in the mid 2000’s and at the time of consideration, had ~ 350,000 loyalty club members. There were 2 major streams of direct marketing that were undertaken directed exclusively at the loyalty club members.
- A bi-annual mailing of a product brochure, with heavy emphasis on seasonal apparel
- Multiple single focus marketing campaigns carried out via multiple channels, throughout the year
The client was adopting a one size fits all strategy, for all direct marketing communication, which they recognized was not optimal. To help them customize their marketing communication, they wanted to use the power of data mining, and approached IRIS TEG.
Broad approach
Looking at the issue at hand, a four step process was suggested, as depicted in the figure below

Owing to space constraints & confidentiality issues, the rest of the article shall primarily focus on Step 1 i.e. customer segmentation and briefly touch upon steps 2-4.
Customer Segmentation Primer
Segmentation, refers to the practice of identifying homogeneous groups which are distinctively different from each other while they share similarities within. In statistical terms we call it as groups have least distance within the group and maximum distance across groups. . Once the distinct customer segments are identified, you then have the ability to market to those groups with the message/offer/tone that best resonates with the niche group.
Various analytical techniques are used for customer segmentation, with the most popular being Cluster Analysis. This technique identifies naturally occurring segments within your customer population and identifies the key variables that are driving these segments.
Advanced techniques like Latent Class Analysis, Decision Trees etc are also used in situations where a Cluster Analysis algorithm does not yield the required results
Basis for segmentation
Customers can be segmented on a variety of attributes, demographic, value based, attitudinal etc. The exact basis for segmentation would depend on the ultimate business objective. The table below illustrates how the business objective dictates the segmentation scheme
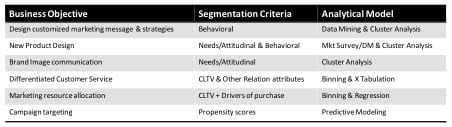
In the case in point, our prime objective was to refine the marketing strategy and move it to a stage of intensive customization. Hence, our recommendation to use behavioural i.e customer purchase patterns as the bases for the segmentation
Data – the fuel of the analytical engine!
The primary source of the data was the customer loyalty system, of the client, which gave us data around three major streams
Customer Transaction details
- Basket level
- Item level within a basket
- Price of items bought
- Amount of discount availed on each purchase
- Mode of settlement
Customer Personal Details
- Demographics – Age, Occupation, Gender, Marital Status etc
- Tenure with Loyalty Program
Item Master Details
- Item code & description
- Item hierarchy across levels
Store Master Details
- Store Size, Age, Competitive Intensity in catchment area
Once the data is received, we kick off the modelling process, which has 6 distinct phases as shown below.
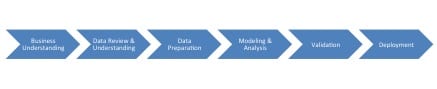
The first two stages, having been covered above we shall concentrate on the process data preparation onwards
Data Preparation
There are three major activities that were carried out in this stage prior to creating the model proper
- The data was transformed from its ‘raw’ state to the customer level, by aggregating key variables
- Some derived variables as per the requirement of the segmentation scheme were created, from the base variables
- The customer base was split into a modelling sample to create the model & a holdout sample to validate our results
At the customer level, the segmentation would be run on key transaction variables, like the ones mentioned below
- Recency, Frequency & Monetary value variables (RFM)
- No. of visits per year
- No. of items purchased per visit
- Amount spent per category per year
- Discount chasing behaviour (proportion of spend, on discounted items)
- Etc
Customer profile variables were also created from their basic information, e.g. Lifestyle preferences from their purchase patterns across formal, casual, Indian and western wear and Life-stage variables using age, marital status & no. of children
Analytical Model
Post creation of the basic data, a Non Hierarchical Cluster Algorithm, was used to determine the segment membership. The modelling process looked at various cluster combinations and decided on a 5 cluster solution as the ideal one. The decision on the exact no. of segments was based on

Segmentation Results
The clusters obtained from the modelling process were profiled on the customer demographics to create a holistic description, based on which they were called
Loyal Families
- 16% of population
- Most Valuable & Loyal Segment
- Purchase for Rs. 15,000 annually
- Make more than 7 trips per annum
- Contribute 37% of annual sales
- Buy Premium priced work wear & Fashionable products
- No promo hunting behaviour
- Married with children, buy across
- Men’s, Women’s & Kids departments
Married Loyal Value Seekers
- 18% of population
- Loyal segment seeking value for money (day to day) products
- Make an average of 7 trips per year
- Buy more than Rs. 10,000 in a year
- Contribute to 25% of annual sales
- Do not buy stylish, adventurous & party wear
- Very little purchases during sales
- Married without children
Married Occasional Shoppers
- 35% of population
- Largest segment in terms of size, but low in value contribution
- Make one trip in 6 months
- Buy about Rs. 3,000 in a year
- Account for 18% of annual sales
- Make just 2 trips a year, but are not promo hunters
- Married without children
- Buy VFM products and avoid Casual & Fashionable products
Single Female Promo Hunter
- 19 % of population
- Visits stores mainly during major discount sales
- Make one trip in 6 months
- Buy about Rs. 3,000 in a year
- Account for just 8% of annual sales
- Least valuable segment in terms of contribution to sales
- Seek Fashionable & Casual products.
- Do not buy VFM & Work wear
Single Male Value Seeker
- 12% of Population
- Smallest segment in terms of size
- Make about 3 trips a year
- Buy about Rs. 6,000 in a year
- Contribute to 12% of annual sales
- About half their purchases are during sales
- Buy VFM & Travel products, Avoids Fashionable & Work wear
Based on our study of the segmentation characteristics a detailed marketing strategy was worked out for each of the segments
Fine-tuning marketing strategy based on segmentation results

Once the broad marketing strategy was decided, the next phase was to set up a series of test & learn experiments, in the form of pilot marketing campaigns, where the strategy was fine tuned in terms of ideal creative, channel of communication etc
The bi-annual marketing brochures were also customised for the segments. The customization was around
- Look & Feel – The valuable segments got a more detailed and well designed brochure.
- Product focus – Each segment had a target category, where they had already shown a past predilection to purchase and a secondary category where we wanted them to start purchasing
Key take-aways & learnings
- Life – stage of a customer is the single greatest determinant of purchase patterns
- Both how much the customer buys and what items she buys.
- Married couples with children are the most valuable customers
- Engaged across Male, Female & Kids departments
- Whereas single customers, both male & female, are primarily deal seekers
- Mostly purchase during major discount sales
- About 2/3rds of loyalty members are occasional shoppers, who visit the store only 2 -3 times a year
- The top 10% members by value, generate almost 40% of the annual sales
- There are more than 55,000 loyalty customers who are listed in the records as Male, but their purchases are overwhelmingly of female products (> 90% of all items bought)
- This indicates a situation where the card carrying member is a passive customer and his spouse make most of the purchase decisions