

When a time series data gets collected, there is other useful and unuseful additional information that also gets collected along with it. This important information embedded in the time-series data must be described as its characteristics. It is a must to do step in time series modelling in the data preprocessing part. If these characteristics are not described and addressed properly, it may lead the model to face issues. In this article, we are going to have an introductory overview of these different important characteristics of a time series. The major points to be discussed in the article are listed below.
Table of Contents
- Trends
- Seasonal Cycles
- Non-Seasonal Cycles
- Pulses and Steps
- Outliers
Trends
In any time series, the trend can be defined as the gradual upward, downward or horizontal movement of values which are noted as the change in time. The trend can be identified by looking at the change in the level of the series.
There are three types of trend can be identified in the time series:
- Uptrend – The movement of values in the upward direction.
- Downtrend- The movement of values in the downward direction.
- Horizontal or stationary trend – The movement of the values is not in any of the directions.
The below image represents the trend of the time series in the upward direction so the trend can be considered as the uptrend.

In any time series we can analyze the trend as local or global. This means local trends are the values between the time series going in either upward or downward direction and the global trend is an overview of the whole time series. In the above images, the global trend of the time series is an uptrend and in some points like around the point 1/88 the local trend is a downtrend and before 1/88 and 1/85 the local trend is an uptrend.
We can fit the global trend and make the forecasting using the exponential smoothing or ARIMA models. They both can give us good results. The ARIMA models use the trend after differencing for forecasting so that the effect of the trend can be removed.
Seasonal Cycles
A seasonal cycle can be considered as a pattern in the time series which is a repetitive pattern in the whole time series and also we can predict those patterns by looking into the past history. The below image can be considered as the representation of the seasonal cycle.

Here in the image, we can see that season cycles are occurring in the intervals of the time series. By this, we can say that the seasonal cycles are tied to the interval of the time series. In the above image, there is a seasonal cycle on a quarterly basis and also there is a monthly seasonal cycle in the time series but it is difficult to judge. Also, it is very easy to say by just seeing in the image there is a yearly seasonal cycle also available.
For example, we can say that by plotting a time series for rainy days for more than two years we can have a seasonal cycle where every year there is a season when most of the rainy days occur.
These patterns are very useful for making the forecast and using exponential smoothing or ARIMA models we can forecast values by capturing the seasonality
Non-Seasonal Cycles
In a time series, the nonseasonal cycle is those patterns that are repetitive in the whole time series but they are not unpredictable. The below image can be a representation of time series with a non-seasonal cycle

There can be various examples of time series where we can observe the Non-Seasonal cycles such as the unemployment rate where the time series clearly shows a cyclic pattern and the interval these patterns are obtained in the series can vary over time. These patterns make the procedure of forecasting difficult. There can be many examples of time series where predictive cycles are presented but they do not fit properly into the Gregorian calendar or we can say that these cycles have such patterns which are longer than a year. For example in india there are many religious holiday date of Hindus varies from year to year
Sometimes it becomes difficult to model time series which have Non-seasonal cyclical patterns because the presence of non-seasonal cycles generally increases uncertainty in forecasting. For example, in the time series of the stock market, there are numerous instances of series that can cause uncertainty in the forecasting. When modelling such a time series it is very necessary to consider the non-seasonal cycle to take into account. In many cases, it is suggested to use the LSTM models for fitting and modelling such time series because they facilitate us to minimize uncertainty in forecasting.
Pulses and Steps
In many time series, we observe the sudden changes in the levels these sudden changes can be considered as the pulse or steps. Pulses and steps can be defined as the following:
- Pulses- in a time series, observations where any sudden movements in the values occur for a small amount of time or temporary time we can call it the pulse in the time series.
- Steps -in a time series, observations where any sudden movements in the values occur for a large amount of time or permanent time we can call it the step in the time series.

The above image can be considered as the representation of the time series where in the point 1/73 we can observe there is pulse till the 1/82 and after 1/82 we can observe steps till the last point.
Whenever we find steps or pulses in the time series it becomes necessary to give a proper reason for their presence in the time series because most of the time series models like ARIMA and VARMA are designed to analyze such data where changes in time series values are gradual. If the sudden changes in the time series values are observed then these models can ignore the pulses or the steps can exploit the procedure of the models by providing some inaccurate forecasted values. Also, some seasonal effects can be felt like the pulse in the time series but the level of changes in the same over the seasonal time period. If it happens we don’t need to be confused between the seasonal cycles and pulse.
If we can explain the reason behind the pulse or step we can model them using an intervention or event. For example, if an embargo is imposed on any system causing the sudden change in the inflation rate of the system by just introducing an intervention point we can model the time series which can provide us with some accurate forecasts.
Outliers
In any time-series movement of values of time series which don’t have proper reason behind the movement can be considered as the outliers. These movements in the values are inconsistent with the remaining time series values and also the presence of these values in the time series can influence our analysis and also can influence the forecasting ability of the models.
The below image is a representation of various types of outliers that can occur in any time series. The blue lines are the representation of assumed time series without outliers. And the red lines are representations of time series with the outlier.
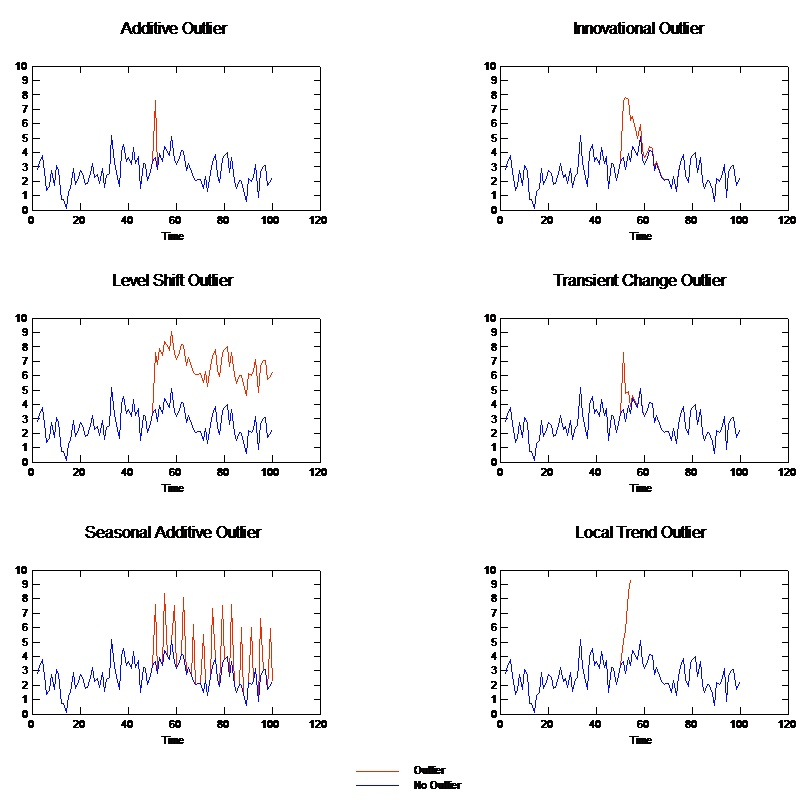
- Additive Outlier. In any time series if we observe a sudden large or small change in a single value we can call this value an additive outlier. Where other values after this changed value are unaffected.
- Innovational Outlier. In the time series, any outlier which occurs and stays and affects a time series for a short time can be considered as the innovational outlier. The influence of the innovational outliers may increase as time proceeds.
- Level Shift Outlier. In the time series if an outlier occurs and shifts the level of all subsequent values permanently can be considered as the level shift outlier.
- Transient Change Outlier. In the time series if an outlier occurs and gives the effects to the subsequent values in an exponential behaviour can be considered as the Transient change outliers. These outliers are similar to level shift outliers, but the effect of the outlier diminishes exponentially but after the effect of the outlier the series returns to its normal status.
- Seasonal Additive Outlier. In a time series if an outlier occurs in such a way that can be considered as the seasonal effect or the outlier occurs repeatedly in regular intervals can be considered as the seasonal additive outlier.
- Local Trend Outlier. In the time series if an outlier occurs and changes the pattern of series and gives a general drift in the series caused by a pattern in the outliers after the onset of the initial outlier can be considered as the local trend outlier.
Final words
In this article, we had an overview of the characteristics of the time series. We have understood these characteristics and seen the effect of those characteristics in modelling and fitting of time series. There are various models which can be used for forecasting procedures like AR, ARIMA, VAR and VARMAX models. Hope this information will be very useful for those who are learning to handle the time series data and trying to build predictive models based on it.