Statistics is a branch of mathematics that deals with quantified models and representations to analyze and perform experiments on real-world data. The fundamental benefit of statistics is that it conveys information in a straightforward manner. The role of statistics in data science and data analytics can not be underlined because it provides powerful tools and strategies for identifying the hidden patterns and aspects of data which most of the time plays a crucial role in data-driven decisions.
Today we are going to see the major and popular concepts of advanced statistics. These concepts are also referred to as inferential statistics which are used when there is a need for critical analysis of data. The major points to be discussed in this article are listed below.
Table of Contents
- Types of Analytics
- Concept of Sample and Population
- What is Hypothesis?
- The Process of Hypothesis Testing
- Selection of Hypothesis Test
Statistics used in data science can be broken down into two major categories – descriptive statistics and inferential statistics. To have a quick glance at your data or to organize, summarize the data, we use descriptive statistics. Whereas inferential statistics deal with sample data taken from whole data and making inferences based on some sort of hypothesis test, and different statistical tests.
Types of Analytics
The process of identifying, evaluating, and communicating significant trends in data is known as analytics. Analytics simply allows us to see insights and important aspects that we might not have noticed in other ways. Analytics is broadly classified into three types – Descriptive Analytics, Prescriptive Analytics, and Predictive Analytics.
Descriptive Analytics
Descriptive analytics is the practice of analyzing past data in order to better understand how a business has changed. Decision-makers gain a holistic perspective of performance and trends on which to develop a corporate strategy using a variety of historical data and benchmarking.
It mainly addresses the question: What has happened?
Predictive Analytics
Predictive analytics uses historical data, statistical modelling, data mining techniques, and machine learning to create predictions about feature outcomes based on historical patterns. The purpose is to provide the best judgment of what will happen in the future rather than simply what has happened. In short, it mainly addresses the question: What Could Happen?
Prescriptive Analytics
Prescriptive analytics is mainly used to choose the best outcome solution from a number of available solutions. Prescriptive analytics present decision possibilities for how to seize a future opportunity or how to avoid future risk as well as the consequences of each available option. In short, it mainly addresses the question: What should we do?
Concept of Sample and Population
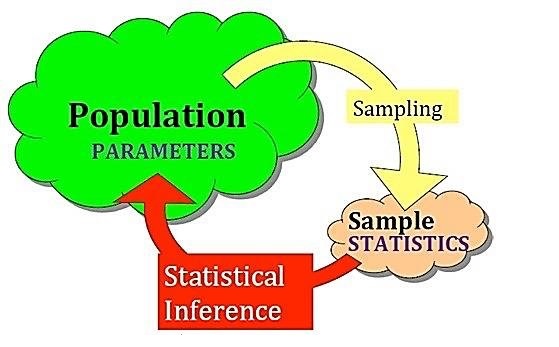
A population is a big group of people or items that are the focus of some scientific inquiry. It is also described as a well-defined group of humans or objects that have comparable features. Common, binding property or trait is frequently shared by all individuals or objects within the group. An example of a population is: There are a total of 369,000 species of flowers discovered by scientist
A sample is a subset of data that a researcher selects from a broader population using predetermined procedures. Sample points, sampling units, and observation all are these terms used to describe these aspects. Either going with the entire population, it is best practice to draw a subset from the population to carry out further analysis.
What is Hypothesis?
A scientific hypothesis is a theory that gives a tentative explanation for a phenomenon or a small group of observations obtained from the population. Falsifiability and testability are the two main characteristics of a scientific hypothesis. A hypothesis is a statement about the population parameter that is based on a set of assumptions. This assumption could be correct or incorrect. A hypothesis, for example, is the statement that the average age of voters in India is 35-40. To assess the viability of this hypothesis researchers can run statistical experiments.
The Process of Hypothesis Testing
The hypothesis testing can be broken down into the major seven steps as shown below. By following the above-sophisticated procedure we can conclude our goal with solid justification.
Steps to be followed in Hypothesis testing

Let’s see the above steps one by one;
Formulate the Hypothesis
When we conduct hypothesis testing it is important to formulate our considered statement into two categories. Basically, it is the assumption that we are defining, namely referred to as Null Hypothesis (denoted by Ho) and Alternative Hypothesis (denoted by HA).
The Null hypothesis is always our initial guess of the assumption, where the alternative hypothesis reflects the opposite guess of the assumption. Now let’s formulate the hypothesis for a simple statement like The average age of voters in India is between 35-40. To test the hypothesis we can restate it like;
- Ho: The average age of voters in India is between 35-40.
- Ha: The average age of voters in India is not between 35-40.
Select the Statistical Test
There are several statistical tests available all these tests aim to compare within-group variance ( checks how data points are spared inside a particular column) against between-group variance (check how data points spread between two columns / how columns are different from each other)
Our chosen statistical test will produce a lower p-value if the between-group variance is large enough that there is almost no overlap between data points of two columns. If the within-group variance is great but the between-group variance is low, our statistical test will reflect the higher p-value.
There are dozens of statistical tests, it is completely based on what kind of data you have chosen. Based on the type of data the test is categorized as a Two-tail test and a One-tail test. Two tail test is carried out when all the data points are normally distributed else the test will be a One-tail test. Further, under the Two-tail test, there is Z-test and T-test, when the population standard deviation is known we go for Z-test else T-test.
Choose Alpha and Degree of Freedom
Choosing the alpha value and degree of freedom are the most important values because in the all-over analysis we are comparing our calculated value considering these as a base. The alpha value is referred to as the error rate in our dataset or level of significance. If our alpha value is 0.05 that means there is a 5% error in our dataset; the remaining 95% is an accurate dataset means all the values are true.
The degree of freedom is the number that states that many values are free to vary in our final conclusion. It can be simply calculated as No.of rows – No.of Columns.
Computing and Comparing test value
Based on the data we have chosen, and after confirming the values of alpha and degree of freedom (for example, 0.05 and 25), we aim to perform a statistical test that will give evidence for the statement. Say we have normally distributed data and standard deviation of the population is known to us, along with this all details we decide to perform a Z-test.

After conducting the Z-test we got a score of say 1.96. We need to compare our calculated value against the critical value for all assumed parameters. Before we begin the test we choose the level of significance and degree of freedom, with help of these we have to get critical value from the standard Table as shown below.

From the above table, the critical value is 2.060 which is greater than the calculated value. Whenever a case like this occurs means the calculated value becomes less than the critical value then we accept the Null hypothesis. For our above-age example if we would have performed these tests and results were obtained like this then we have to accept the Null Hypothesis.
Selection of Statistical test
As discussed earlier the election of a proper statistical test completely relies on the type of data under consideration. The below diagram shows when and which test to be used. The test is broadly classified into two categories i.e parametric test and non-parametric test.

The parametric test assumes that the underlying data is well normally distributed based on that we do further calculations. Where on the other hand non-parametric tests don’t make any assumption regarding the parameters of the population.
Conclusion
In this article, we have seen the most popular and interviewers’ favourite topics of Advance statistics. Starting from the type of analytics, we have seen what hypothesis means in general terms, later procedure of hypothesis testing, and lastly, the types of statistical tests that we need to conduct in hypothesis testing.


