As far as regression models are concerned, there is a certain degree of level of correlation between the independent and dependent variables in the dataset that let us predict the dependent variable. In statistics, this correlation can be explained using R Squared and Adjusted R Squared. In other words, R Squared and Adjusted R Squared help us determine how much of the variation in the value of a dependent variable (y) is explained by the values of the independent variable(s) (X, X1, X, X2 ..).
In this article, we will learn what is R Squared and Adjusted R Squared, the differences between them and which is better when it comes to model evaluation.
What is R Squared?
R Squared is used to determine the strength of correlation between the predictors and the target. In simple terms it lets us know how good a regression model is when compared to the average. R Squared is the ratio between the residual sum of squares and the total sum of squares.
Where,
- SSR (Sum of Squares of Residuals) is the sum of the squares of the difference between the actual observed value (y) and the predicted value (y^).
- SST (Total Sum of Squares) is the sum of the squares of the difference between the actual observed value (y) and the average of the observed y value (yavg).
Let us understand these terms with the help of an example. consider a simple example where we have some observations on how the experience of a person affects the salary.
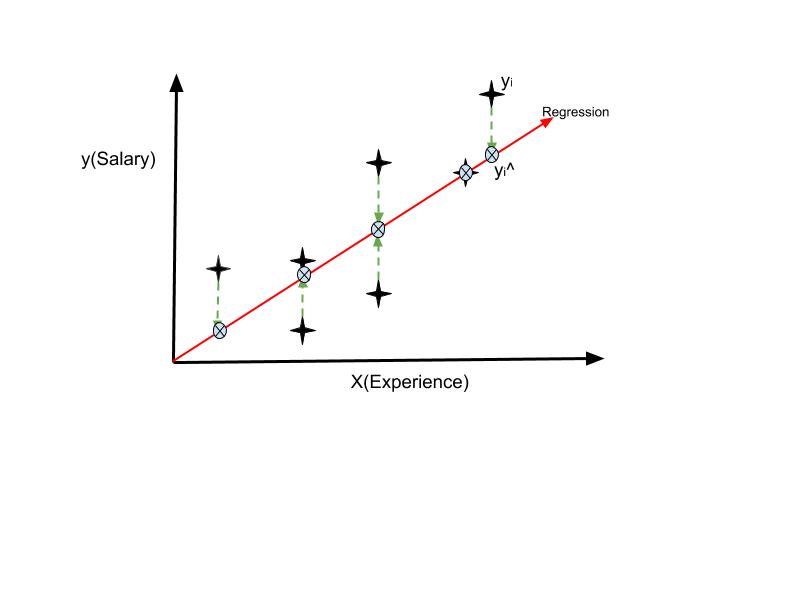
Suppose the regression looks like what is shown below :
We have the red line which is the regression line that depicts where the predicted values of Salary lies with respect to the experience along the x-axis. The stars represent the actual values of the salary which is the observed y value with respect to experience. The cross marks represent the predicted value of salary for an observed value of experience which is denoted by y^.
Now,
Where n is the number of observations.
Note :
SSR is the best fitting criteria for a regression line. That is the regression algorithm chooses the best regression line for a given set of observations by drawing random lines and comparing the SSR of each line. The line with the least value of SSR is the best fitting line.
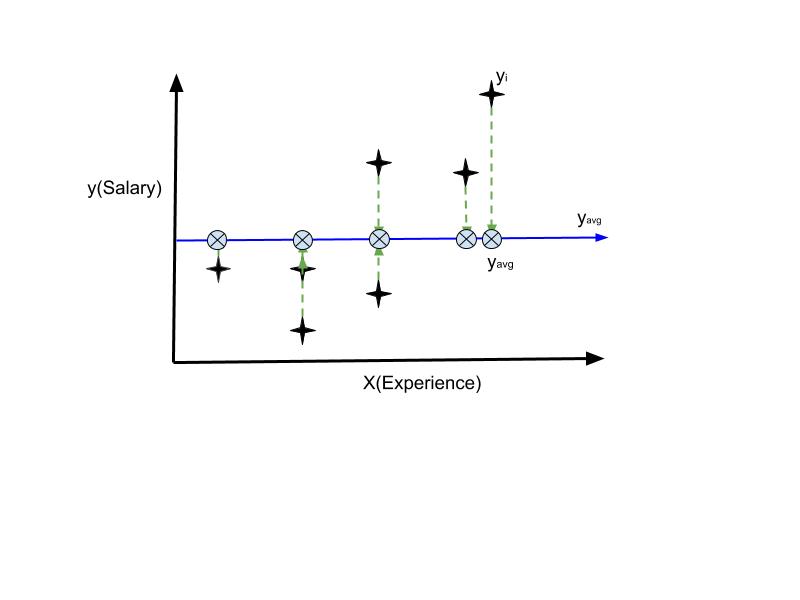
The blue line in the above image denotes where the average Salary lies with respect to the experience.
R squared can now be calculated by :
Now consider a hypothetical situation when all the predicted values exactly match the actual observations in the dataset. In this case, y will be equal to y^ for all the observations, hence resulting in SSR to be equal to zero.
If SSR = 0,
![]()
In another scenario, if the predicted values lie far away from the actual observations, SSR will increase towards infinity. This will increase the ratio SSR/SST, hence resulting in a decreased value for R Squared.
Thus R Squared will help us determine the best fit for a model. The closer R Squared is to one the better the regression is.
Why Adjusted R Squared?
We already know how R Squared can help us in Model Evaluation. However, there is one major disadvantage of using R Squared. The value of R Squared never decreases. If you are wondering why does it need to decrease since it will only result in a bad model, there is a catch, adding new independent variables will result in an increased value of R Squared. This is a major flow as R Squared will suggest that adding new variables irrespective of whether they are really significant or not, will increase the value.
R Squared has no relation to express the effect of a bad or least significant independent variable on the regression. Thus even if the model consists of a less significant variable say, for example, the person’s Name for predicting the Salary, the value of R squared will increase suggesting that the model is better.
This is where Adjusted R Squared comes to the rescue.
Adjusted R Squared
Compared to R Squared which can only increase, Adjusted R Squared has the capability to decrease with the addition of less significant variables, thus resulting in a more reliable and accurate evaluation.
Degree Of Freedom
By definition, it is the minimum number of independent coordinates that can specify the position of the system completely. In this context, we can define it as the minimum number of data points or observations required to generate a valid regression model.
Let us understand what this means and how it plays its part in Adjusted R Squared.
Consider the example of Experience Vs Salary. Say, we have just one observation or sample. In this case, there are infinite possibilities of drawing a best fitting regression line passing through the one data point.
Suppose if there are two observations then, there can be one best fitting line that passes through both the points. But irrespective of the value of the two y’s, it will always result in a best fitting line with R Squared equal to one thus making it unable to determine the correlation between salary(y) and experience(X).
Adding a third observation will introduce a level of freedom in actually determining the relation between X and y and it will increase for every new observation. That is, the degree of freedom for a regression model with 3 observations is equal to 1 and will keep on increasing with additional observations.
Now suppose if there are more than one independent variables, say X1, X2,.., this would result in different degrees of freedom. Having two independent variables would result in a 3D plane, thus requiring at least 4 observations to achieve a degree of freedom of one. This relationship between the number of observations and the number of independent variables and the regression is expressed as :
Where,
- k is the number of independent variables
- n is the number of observations
The relationship with R Squared and degrees of freedom is that R Squared will always increase as the degrees of freedom decreases which as we saw earlier drastically reduces the reliability of the model. Adjusted R Squared, however, makes use of the degree of freedom to compensate and penalize for the inclusion of a bad variable. Adjusted R Squared can be expressed as :
i.e.
The value of Adjusted R Squared decreases as k increases also while considering R Squared acting a penalization factor for a bad variable and rewarding factor for a good or significant variable. Adjusted R Squared is thus a better model evaluator and can correlate the variables more efficiently than R Squared.


