With massive amounts of data generated every day, businesses and organisations want to make sense of it to produce actionable, accurate and real-time insights.
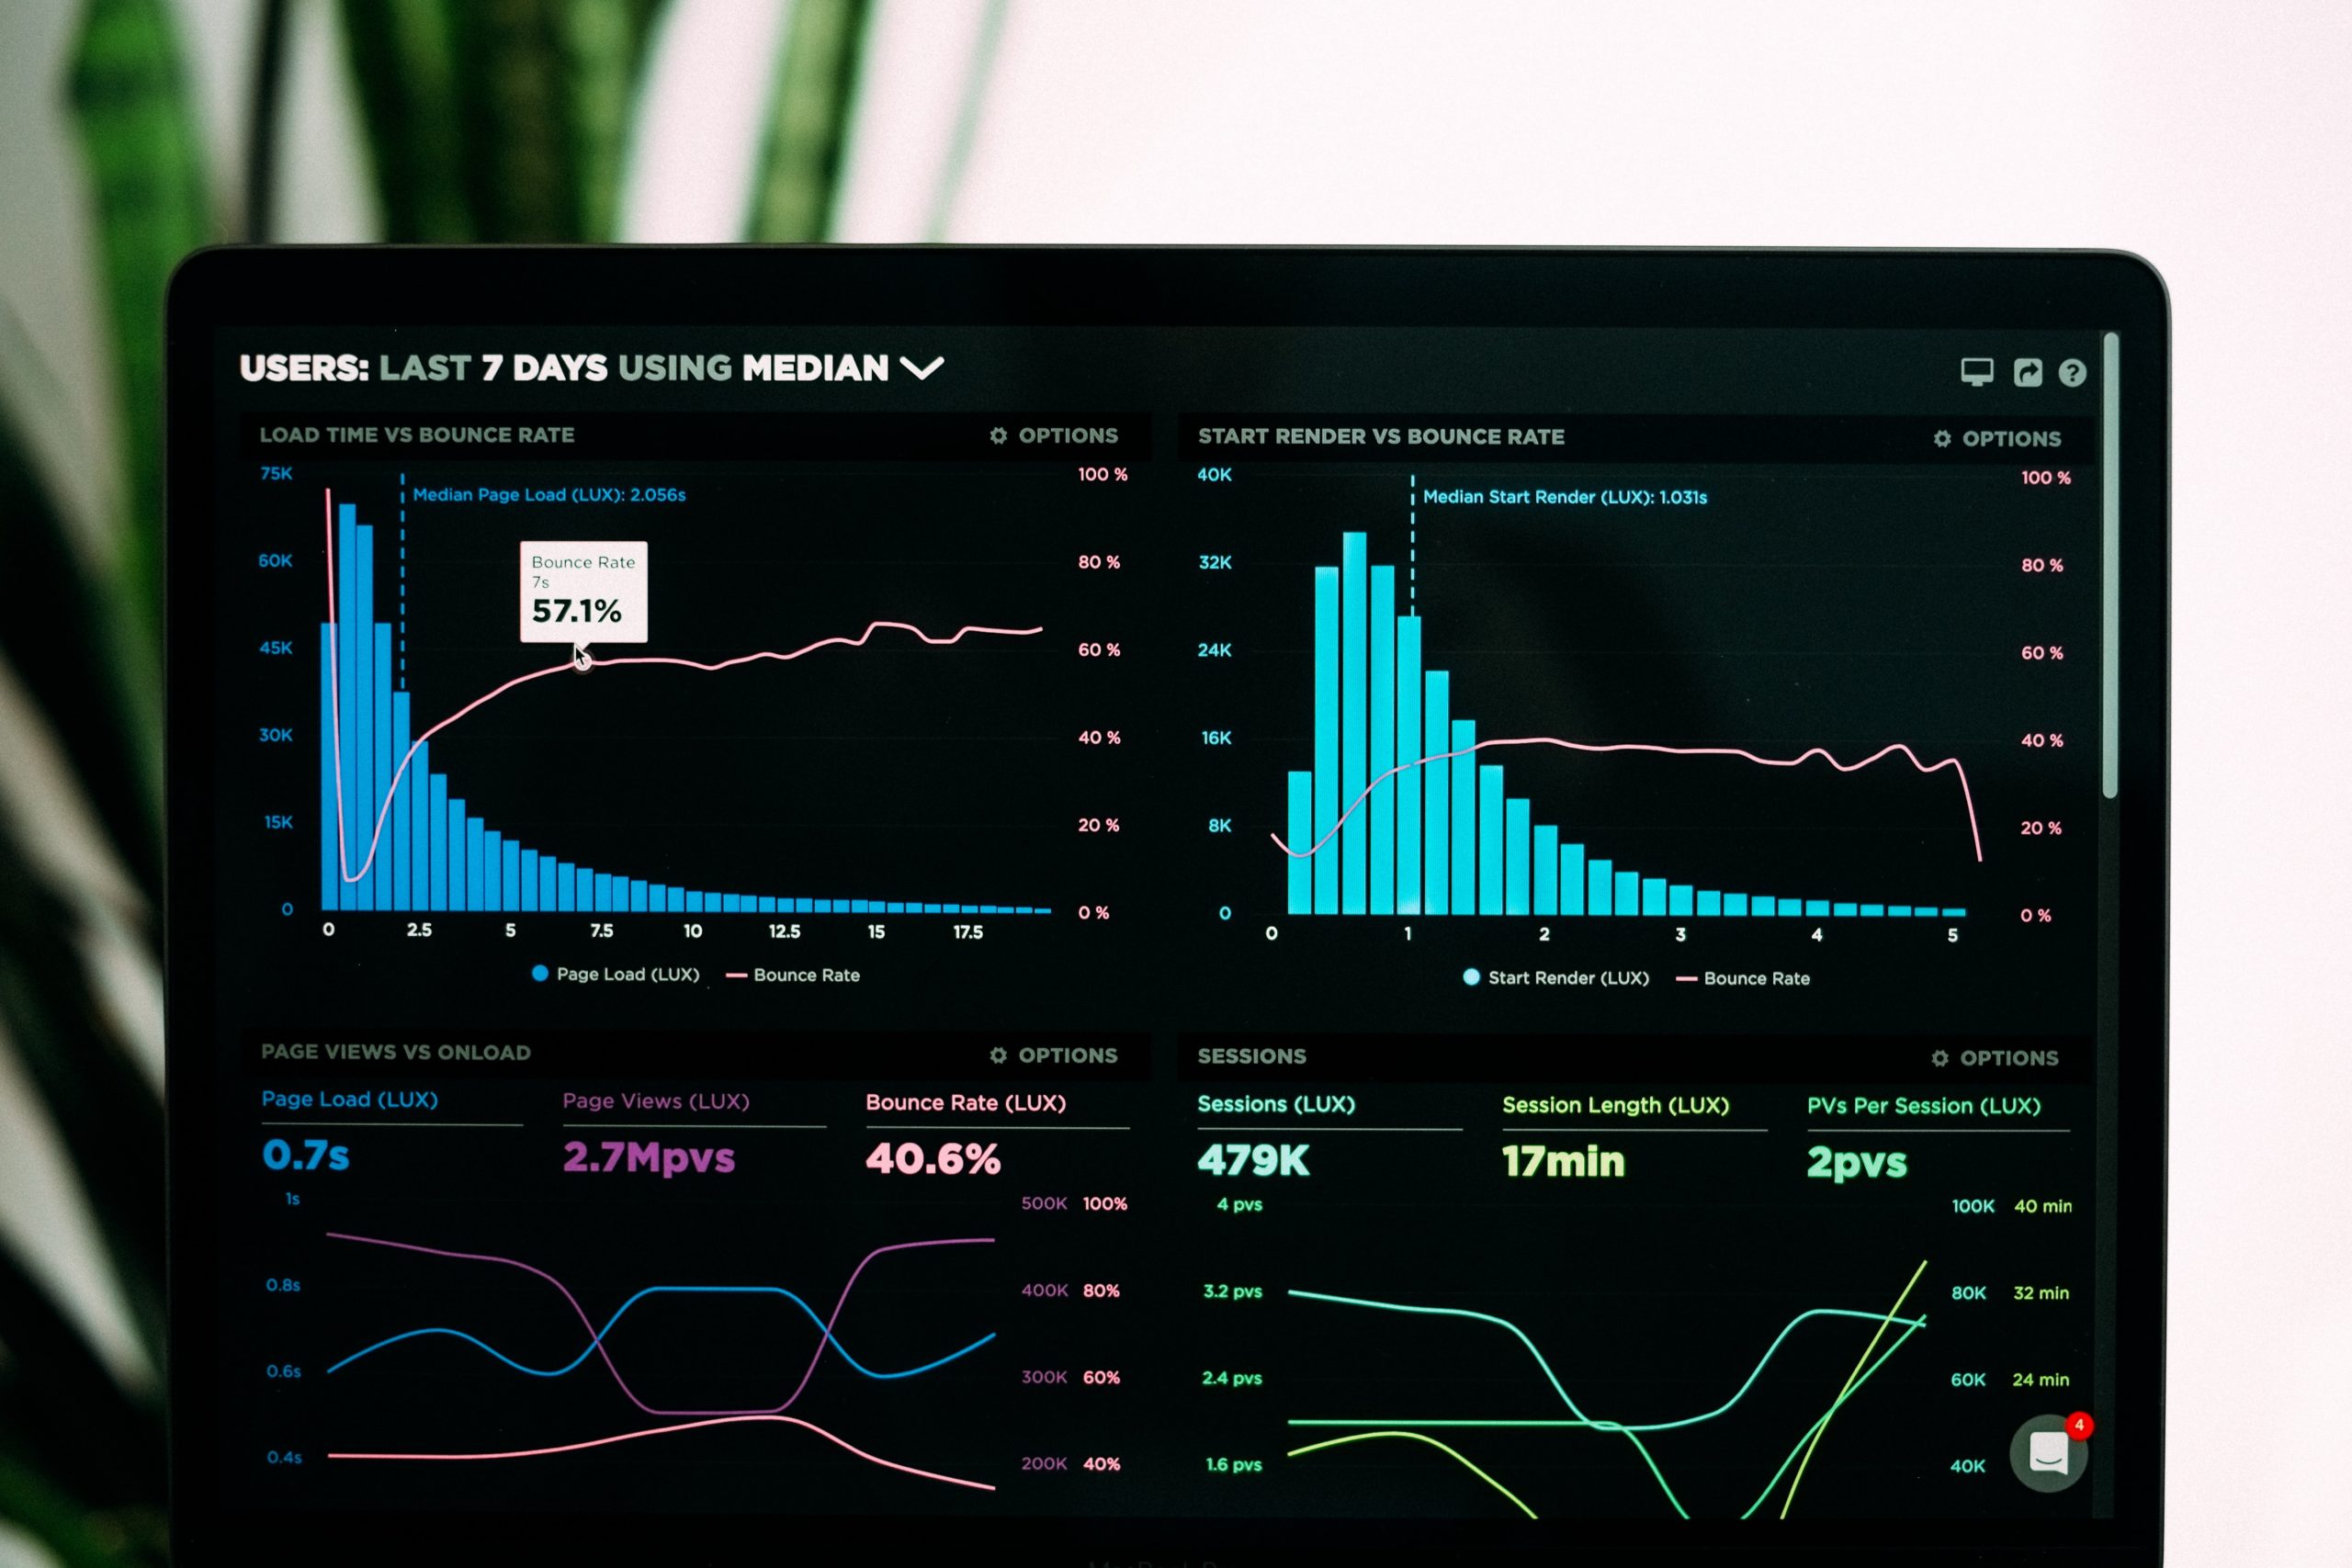
These organisations use various automated visual analytics tools to analyse this data and present them in the form of infographics and dashboards, which supports them in their decision-making.
Analytics India Magazine enlists some of the top Visual Analytics providers whose products and applications have relevance in 2021.
Qlik
With some of the most sophisticated array of visualisations, Qlik is a pioneer in visualisation analytics software. With Qlik Sense and QlikView, it helps with a wide range and unorthodox ways of presenting data. Its ‘associative analytics engine’ in Qlik Sense moves away from a query-based approach and lets you explore data without any limitations. The engine lets you combine all your data sources to build data relationships without the need for cleaning or modelling your data in advance.
DataDeck
This two-time award-winning data visualisation company from Japan provides a visual analytics platform with the same name that can help monitor the progress of different KPIs across teams in real-time. The platform lets you connect with 100 different data sources, including YouTube, Trello, MailChimp apart from the usual sources like Excel and SQL, to get real-time insights from the data on those platforms. The app can be accessed from your phones and has a Slack extension.
Data Clarity
A US-based firm, Data Clarity, provides three products that have a holistic interface to carry out data and visual analytics. The Analytics & Data Integration Hub by Data Clarity provides an end-to-end visual analytics solution. One can prepare the data using simple drag and drop solutions, explore it with a variety of interactive graphical, tabular, and geospatial visualisations and then storyboard it. Users can advance analysis using built-in AI and ML pre-curated models that have been integrated through third-party platforms.
Ubiq
Another US-based firm, Ubiq provides a web-based visual analytics software that can help you build visualisations using drag and drop. You can share results and insights from the data analysis through interactive visualisation. It provides you with a real-time analysis that lets you dynamically filter or slice data without the use of any code. You can access data from multiple locations across databases, including MySQL, MariaDB, Amazon RDS data.
Geckoboard
A UK-based firm, Geckoboard specialises in what it calls TV dashboarding. The company creates dashboards that are more customisable to TV or bigger screens and can help companies define goals and monitor performances through KPIs that can change real-time. The platform connects to more than 60 data sources across horizontals like finance, marketing project management, social media, and other teams.
Locii
This is a Greek-based firm that one should look for if they want more customisable solutions in visual analytics. With the same approach for every customer but different implementation, their platform, Insight, is a BI product tailored to suit one’s needs. Locii helps you in an end-to-end process in visual analytics. They build sample reports free of charge to start with and then help you in design, development, and implementation. With a 24/7 maintenance available, they also provide training to your employees.
AnyChart
AnyChart provides products for those who are slightly well-versed with HTML and JavaScript. Their products provide robust JavaScript charting libraries with APIs, documentation, and enterprise-grade support. Developers can integrate a variety of charts into their mobile, desktops, or web products. Their component is compatible with any database and runs on any platform. Developed for developers, they have an open-source code which can be edited with great flexibility.
Tableau
Acquired by Salesforce last year, Tableau is one of the most used platforms across industries for dashboarding and visual analytics. Various products from Tableau can be used for developing visualisations and dashboards using simple drag and drop methods. Individual products have advanced features that can cater to different needs. For instance, it provides a tool that can build a visualisation based on a user’s query that is asked in natural language. It can also provide AI-driven insights based on the data uploaded. The platform provides compatibility with well-known cloud platforms and can access data locally as well.
Arcadia Data
Arcadia Data was acquired by Cloudera last year. The company provides four visual analytics products. The first one is called Cloud-Native BI, which is a cloud-based serverless pay-per-use visual analytics tool. The second Streaming Visualisations lets you visualise live streaming data for applications like fraud detection and operations optimisation. The BI on Hadoop software lets you analyse big data. Lastly, one can use the Search-Based BI and Analytics tool to get visual answers to questions asked in natural language.
Microsoft
Microsoft’s Power BI lets you access data from hundreds of local and cloud-based sources to develop deep and actionable insights for a broad range of scenarios. One can use their feature Power Query to view how the database looks to prep and model their data. Apart from dashboarding, the tool uses advanced analytics to present insights that one might have missed. You can then create interactive, sophisticated, and customised reports using the platform.


