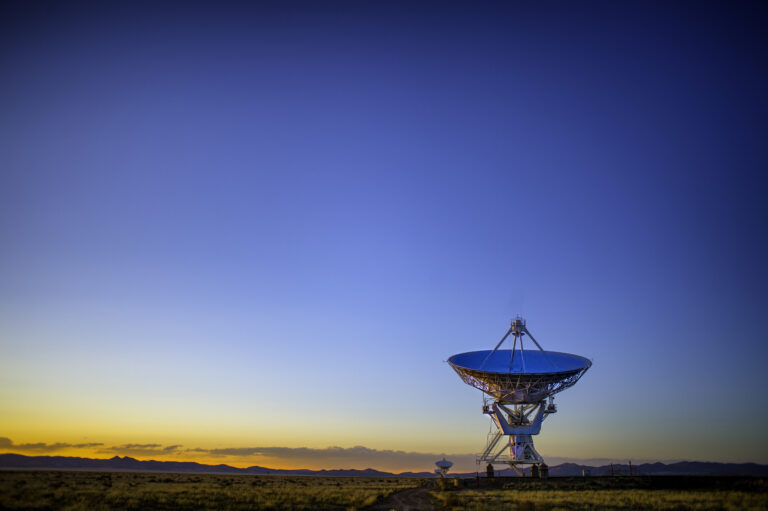
Geospatial analytics is finding its way into functions as varied as marketing to disaster management. A search using Google’s Ngram Viewer shows that the term ‘Geospatial’ entered literature during the late 1980s but has seen a growth in popularity since then.
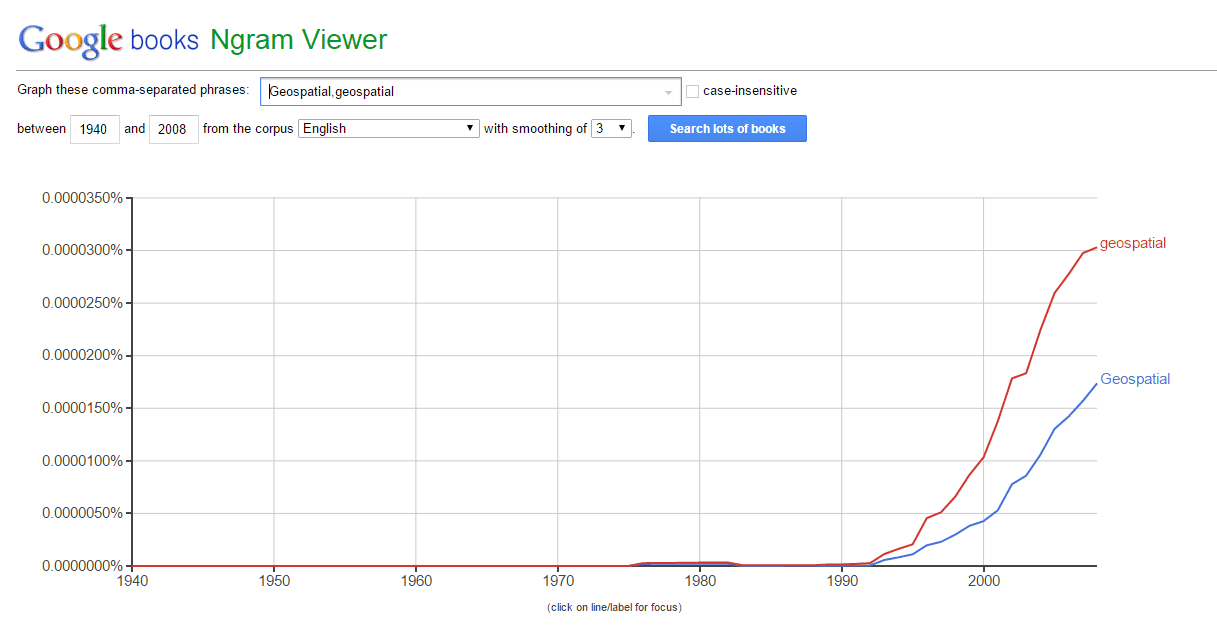
Image: Frequency of the term “Geospatial” in publications. Image Source
What is Geospatial data?
Geospatial data is information that identifies the geographic location and characteristics of natural or constructed features and boundaries on the earth, typically represented by points, lines, polygons, and/or complex geographic features. This includes original and interpreted geospatial data, such as those derived through remote sensing including, but not limited to, images and raster data sets, aerial photographs, and other forms of geospatial data or data sets in both digitized and non-digitized forms. [Source: EPA’s National Geospatial Data Policy, August 2005]
To put it simply, it is the data that identifies the geographic location of features and boundaries on Earth.
Types of Geospatial data
While our real world comprises of hills, fields, rivers, forests, buildings etc., in the world of geospatial data, these landscapes are represented in two ways:
1) Vector and
2) Raster
Image: Raster & Vector Geospatial data. Image Source
In the vector data format, geographic information is represented as points, lines, polygons and TINs (triangular irregular networks).
In the raster data format, information is represented using a grid system. Points are represented by single cells, lines by sequences of neighbouring cells, and areas by collection of grouping cells.
Each data format has their specific use case. Vector data format is used for representing non-continuous data like rivers, road lines, mountain peaks, etc. Raster data format is useful to represent continuous data like slope, elevation, chemical concentration, land usage, etc.
Adding a Geographic Context to your Data
Geotagging
Imagine you are holidaying somewhere and you find this exotic location. You click pictures to share with your friends on Facebook. What if in addition to tagging who you are with, you tag your image with the exact latitude and longitude of the place so that your friends find it easier to spot the same location when they are around.

Image: Geotagged Image. Image Source
This process of tagging media with geographic identifiers like latitude & longitude coordinates, altitude, distance, location names, etc. is called Geotagging. The tagged media could be anything from a photograph to a video to a website, an SMS, QR Codes, etc.
Geocoding
Now imagine you have invited your friends for your house warming party. They are new to the area and may find it difficult to find the exact location just by using your address. To help them further, along with your new address, you send them the exact longitude and latitude of the place. This will enable them to track the exact location much faster using their GPS device (Read the Google Map app on your smartphone for all practical purposesJ )
Image: Geocoded location. Image Source
This process of enriching a description of a location by adding geographic identifiers is called Geocoding (or Forward Geocoding). Alternatively, if you add a description to a geographic identifier it is called Reverse Geocoding.
So what do you do with all this data?
Geospatial Analytics and answering the ‘where’ of your data!
Simply put, geospatial analytics is data analytics based on location. Data is described in terms of geographic coordinates, street address, postal code, etc. Such an analysis helps to add a geographic context to data and uncover trends and patterns that are otherwise invisible through traditional visualization methods.
Let’s say a retailer is in the process of expansion and finding new locations for opening stores. Traditional analytics will help the retailer identify what she should stock, who she should target, the expected sales based on historic data, etc. With the help of Geospatial Analytics, she would be able to find answers to questions like optimal location of stores to minimize the distance customers have to travel to reach her stores, what are the risks involved in the chosen area and many such things.

Image: Answering the ‘where’ of your data. Image Source
An ideal geospatial analytics system should go over and above unidimensional interpretation of data. It should allow users to overlay business data on maps and interact with the content, to drill, filter, analyze and generate location insights. Users should be able to overlay metrics from multiple sources of business data and also external data sources, like social media, demographics, lifestyle and weather data.
One such player which combines BigData, Analytics and GIS to provide insights about customer segments and catchment areas is Quantaa Analytics.

Image: Catchment Area Analysis. Image Source
It help clients identify attractive areas around their existing store. Mapping competitors and other important sales generators (establishments those help increasing sales directly / indirectly) provides additional information about important POIs (point of interest) for marketing campaigns in and around the area.
Geospatial Analytics and its Application
In addition to the use case of retail already cited above, here are some of the many other use case scenarios of Geospatial Analytics:
Financial Institutions:
- Asset & facilities management (Figure out the best locations for new ATM machines)
- Analysing sales patterns and market histories
- Business continuity & planning
- Analysis of profit model inefficiencies and many more
Government Agencies:
- Effectively track the outbreaks of deadly diseases and determine where to position resources to be of the most help
Watch this video for details:
In fact Google has an ongoing project under Google.org which aggregates search data with location data to estimate current flu activity around the world in near real-time.
Defence & Intelligence
Palantir Technologies, a Palo Alto-based big data start-up with clients like the NSA, FBI and CIA, have worked on several such intelligence projects. Its software is rumoured to have been used in tracking down Osama bin Laden.
Another such project they are involved with is working closely with researchers and open source information to help understand Iran, its alliances and economic dependencies, military strengths and projects to help better understand the potential threats it can cause.
Watch this video for details:
https://www.youtube.com/watch?v=9ooAUeTlzdU
Key players in the Geospatial Analytics space
ArcGIS
Esri’s ArcGIS is a paid geographic information system (GIS) for working with maps and geographic information. It is used for creating and using maps, compiling geographic data, analysing mapped information, sharing and discovering geographic information, using maps and geographic information in a range of applications, and managing geographic information in a database.
QGIS (previously known as Quantum GIS)
QGIS is a cross-platform free and open-source desktop geographic information system (GIS) application that provides data viewing, editing, and analysis capabilities. Similar to other software GIS systems QGIS allows users to create maps with many layers using different map projections. Maps can be assembled in different formats and for different uses.
Google Maps is a product that needs no introduction. If you have ever been on a road trip and have wondered whether to take a left or right, you would have probably ended up using the Google Map app.
In its simplest form it is a desktop and mobile web mapping service application and technology, offering satellite imagery, street maps, and street view perspectives, as well as functions such as a route planner for traveling by foot, car, bicycle, or with public transportation.
In its more elaborate form it has solutions like Google Earth Outreach, which gives non-profits and public benefit organizations the knowledge and resources they need to visualize their cause and tell their story in Google Earth & Maps. Another such solution is Google Maps for Work, which provides developers with access to a full range of Google Maps APIs in the cloud so that they are able to deliver location-relevant insights to their clients. This solution is currently available only for U.S.
To sum up, Geospatial Analytics is an evolving field where the possibilities of exploring new geographic frontiers (both literally and metaphorically) are indeed endless.