

In machine learning, we need lots of data to build an efficient model, but dealing with a larger dataset is not an easy task we need to work hard in preprocessing the data and as a data scientist we will come across a situation dealing with a large number of variables here PCA (principal component analysis) is dimension reduction technique helps in dealing with those problems.
In this article, we will demonstrate how to work on larger data and images using a famous dimension reduction technique PCA( principal component analysis).
Topics Covered in this article
- How does PCA work?
- How does PCA work on Image compression?
- How does PCA work on a normal Dataset?
- Limitations of PCA
How does PCA work…?
PCA is a dimensionality reduction that is often used to reduce the dimension of the variables of a larger dataset that is compressed to the smaller one which contains most of the information to build an efficient model. In a real-time scenario when you are working reducing the number of variables in the dataset you need compromise on model accuracy but using PCA will give good accuracy. The idea of PCA is to reduce the variables in the dataset and preserve data as much as possible.
How does PCA work on Image Compression?
The image is a combination of pixels in rows placed one after another to form one single image each pixel value represents the intensity value of the image, so if you have multiple images we can form a matrix considering a row of pixels as a vector. It requires huge amounts of storage while working with many images where we are using PCA is used to compress it and preserve the data as much as possible.
Hands-on implementation of image compression using PCA
Importing libraries.
import matplotlib.image as mplib
import matplotlib.pyplot as plt
import numpy as np
from sklearn.decomposition import PCA
Reading an image and printing the shape of the image.
img = mplib.imread('/content/opengenus_logo.png')
print(img.shape)
plt.imshow(img)

Reshaping the image to 2-dimensional so we are multiplying columns with depth so 225 X 3 = 675.
img_r = np.reshape(img, (225, 582))
print(img_r.shape)

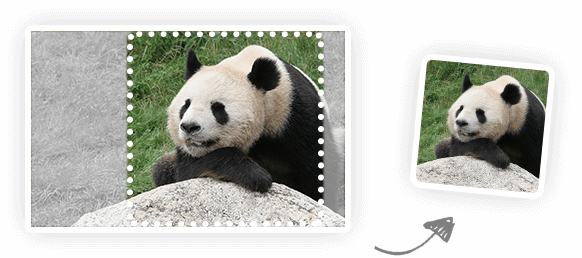
Applying PCA so that it will compress the image, the reduced dimension is shown in the output.
pca = PCA(32).fit(img_r) img_transformed = pca.transform(img_r) print(img_transformed.shape) print(np.sum(pca.explained_variance_ratio_) )Retrieving the results of the image after Dimension reduction. temp = pca.inverse_transform(img_transformed) print(temp.shape) temp = np.reshape(temp, (225,225 ,3)) print(temp.shape) plt.imshow(temp)

As you can see in the output, we compressed the image using PCA.
How does PCA work on Machine learning Dataset?
As a data scientist, we need to solve the larger datasets of nearly 1000’s of columns. It’s very hard to preprocess and visualize the larger datasets. By PCA we can solve this problem and compress that multidimensional data into a single column. In the below code snippets we will try to implement PCA on a dataset and use the k-means algorithm on a compressed dataset to divide into clusters.
Implementation of image compression using PCA
#Importing libraries.
import numpy as np
import pandas as pd
import matplotlib.pyplot as plt
from sklearn.decomposition import PCA
#Reading dataset.
wine = pd.read_csv("/content/wine.csv")
wine.describe()

Applying PCA to compress the data.
pca=PCA(n_components=13)
pca_values=pca.fit_transform(wine_data)
var = pca.explained_variance_ratio_
pca.components_[0]
How compressed data is distributed.
var1 = np.cumsum(np.round(var,decimals = 4)*100)
var1

We are storing the PCA compressed dataset.
z =pca_values[:,2]

We are testing compressed new data on the k-means algorithm.
new_df = pd.DataFrame(z)
new_df
from sklearn.cluster import KMeans
kmeans = KMeans(n_clusters = 3)
kmeans.fit(new_df)
Kmeans.labels_

As you can see in the output, we divided the PCA applied data on the k-means algorithm by dividing them into 3 clusters.
Limitations
- We cannot apply PCA on categorical features, we need to create a dummy variable for it.
- We lose the independent variable so that we can not interpret them.
- If each value in the data is very important then PCA should not be your choice because there will be a loss of the data in the process of dimension reduction.
Conclusion
In the above demonstration, we discussed how PCA is used as a dimension reduction on image compression, machine learning dataset, and implementing the compressed dataset on the K-means algorithm.