

In machine learning, we regularly deal with mainly two types of tasks that are classification and regression. Classification is a task where the predictive models are trained in a way that they are capable of classifying data into different classes for example if we have to build a model that can classify whether a loan applicant will default or not. But regression is a process where the models are built to predict a continuous variable for example if we need to predict the house prices for the upcoming year.
In both the tasks we do the basic data processing followed by splitting the data into training and testing sets. We use training data to train the model whereas testing data is used to compute prediction by the model. Many different algorithms can be used for classification as well as regression problems but the idea is to choose that algorithm that works effectively on our data. This can be done by doing the evaluation of the model and using error metrics. Different evaluation methods are used like confusion matrix, accuracy score, classification report, mean square error etc.
This article demonstrates a classification and regression problem where we will first build the model and then we will evaluate to check the model performance. We will be using prime diabetes data for doing the classification task where we need to classify whether a patient is diabetic or not. Also, we will explore the wine dataset to do the regression task where we need to predict the quality of the wine.
What you will learn from this article?
- How to build a classification model?
- How to build a Regression model?
- How to check the model performance using different error metrics?
Classification Model
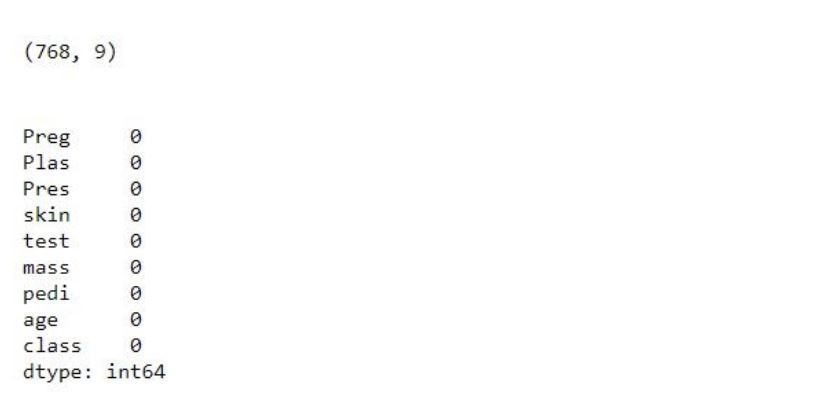
We will first import the required libraries followed by the data. We will then process the data set for basic data preprocessing. In this experiment, we have taken the Pima Indian Diabetes dataset that is publicly available on Kaggle. In this dataset, there are a total of 768 rows and 9 columns in the data with no missing value. Use the below code to do the same.
import pandas as pd
from sklearn.preprocessing import StandardScaler
from sklearn.model_selection import train_test_split
from sklearn.ensemble import RandomForestClassifier
from sklearn import svm
from sklearn.metrics import accuracy_score,precision_score,recall_score,confusion_matrix,classification_report,f1_score

pima= pd.read_csv('pima.csv')

print(pima.head(10))
print(pima.shape)
print(pima.isnull().any())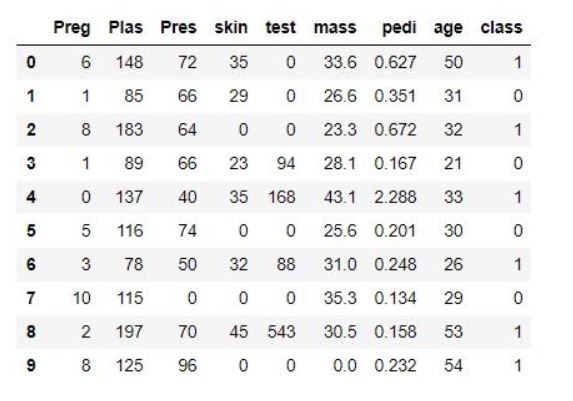
 After that, we will define the dependent and independent features X and y respectively. We then scale the data and then split it into training and testing sets. After that, we will fit the training data to the model and make predictions for the testing data. We will make use of the Random Forest classifier and Support Vector machine algorithm for building two models. Use the code below to the same.
X = pima.drop('class', axis = 1)
y = pima['class']

X_train, X_test, y_train, y_test = train_test_split(X, y, test_size=0.33, random_state=42)

std = StandardScaler()

X_train = std.fit_transform(X_train)
X_test = std.fit_transform(X_test)

rfcl = RandomForestClassifier()
rfcl.fit(X_train,y_train)

y_pred_rfcl = rfcl.predict(X_test)

svc = svm.SVC()

y_pred_svc = svc.predict(X_test)
We have stored our prediction of testing data in y_pred_rfcl variable and y_pred_svc. We will make you use this variable for the evaluation of the model. We will now compute different error metrics to check the model performance like accuracy_score, confusion_matrix, classification_report, f1_score. Use the below code to compute different error metrics.
print(accuracy_score(y_pred_rfcl,y_test))
print(accuracy_score(y_pred_svc,y_test))
print(confusion_matrix(y_pred_rfcl,y_test))
print(confusion_matrix(y_pred_svc,y_test))
print(f1_score(y_pred_rfcl,y_test))
print(f1_score(y_pred_svc,y_test))
print(classification_report(y_pred_rfcl,y_test))
print(classification_report(y_pred_svc,y_test))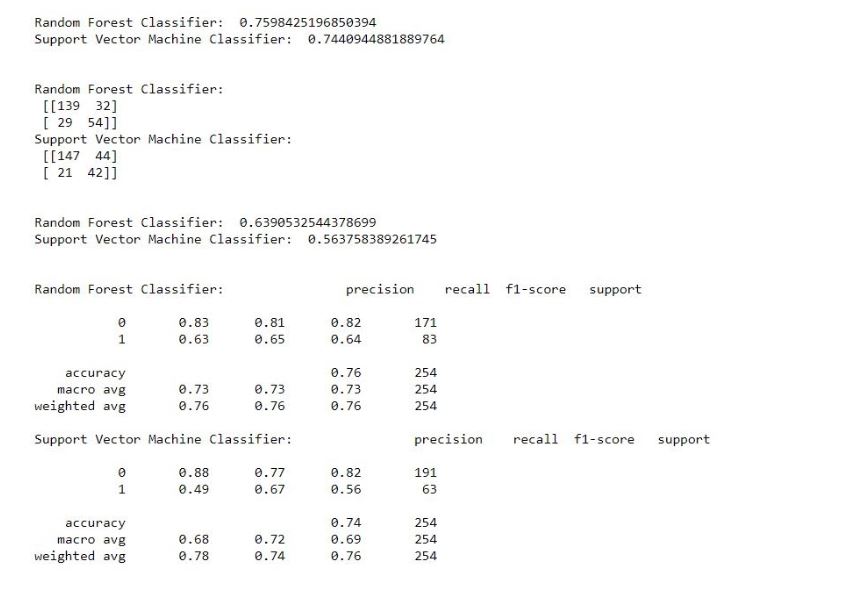
Regression Model
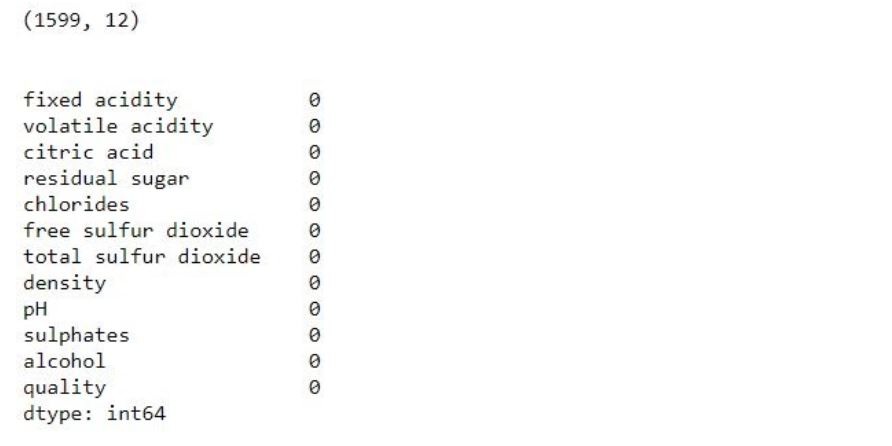
We will first import the required libraries that are required and load the data set. We will be using the wine dataset for this problem that can be downloaded directly from Kaggle. After which we will load the data followed by pre-processing of the data. There are a total of 1599 rows and 12 columns in the data set. There were no missing values found in the data. Use the below to code to the same.
import pandas as pd
from sklearn.preprocessing import StandardScaler
from sklearn.model_selection import train_test_split
from sklearn.linear_model import LinearRegression
from sklearn.ensemble import RandomForestRegressor
from sklearn.metrics import mean_squared_error,mean_absolute_error

print(data.head(10)
print(data.shape)
print(data.isnull().any())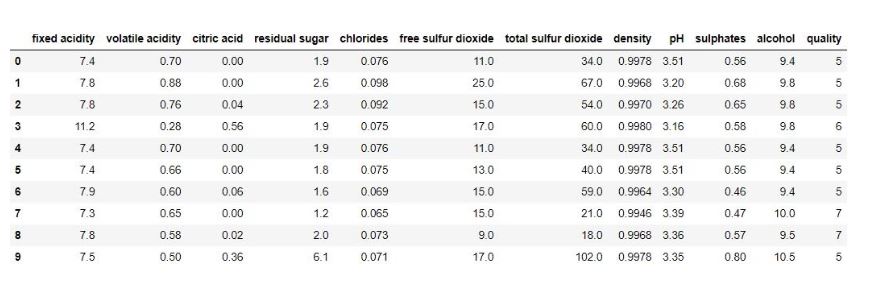
After that, we will define the dependent and independent features X and y respectively. We then scale the data and then split it into training and testing sets. After that, we will fit the training data to the model and make predictions for the testing data. We will make use of Linear Regression and Support Vector Machine Regression for building two models. Use the code below to the same.
X = data.drop('quality', axis =1)
y = data['quality']

std = StandardScaler()

X_train, X_test, y_train, y_test = train_test_split(X, y, test_size=0.33, random_state=42)

X_train = std.fit_transform(X_train)
X_test = std.fit_transform(X_test)

lr = LinearRegression()
rfr = RandomForestRegressor()

lr.fit(X_train,y_train)
rfr.fit(X_train,y_train)

y_pred_lr = lr.predict(X_test)
y_pred_rfr = rfr.predict(X_test)
We have stored our prediction of testing data in y_pred_lr and y_pred_rfr. We will make use of this variable for the evaluation of the model. We will now compute different error metrics to check the model performance like mean squared error and mean absolute data.
print("Mean Squared Error: ", mean_squared_error(y_pred_lr,y_test))
print("Mean Squared Error: ",mean_squared_error(y_pred_rfr,y_test))
print("Mean Absolute Error: ",mean_absolute_error(y_pred_lr,y_test))
print("Mean Absolute Error",mean_absolute_error(y_pred_rfr,y_test))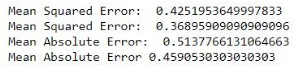
Conclusion
We have computed the evaluation metrics for both the classification and regression problems. We can always try improving the model performance using a good amount of feature engineering and Hyperparameter Tuning. Read more about error metrics here in this article “Top 10 Model evaluation Machine Learning Enthusiast should know”. I hope you have now understood how you can build a classification and regression model and also how to evaluate the model using different metrics discussed above.