

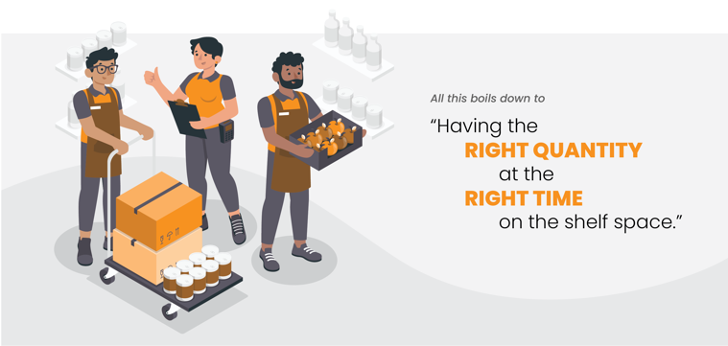
‘Consumers expect products to be on the shelf when they need.’
Approximately 49% of customers choose same or next day deliveries when shopping online. Hence, for physical stores to retain customers and stay in the game, ensuring on-shelf availability of products is key. This has become one of the biggest challenges in consumer expectations in recent years.
For example, Walmart estimated that poor in-full (availability) performance accounted for $1.7 billion in lost sales during the 2018 fiscal year. Physical stores need to maximize revenue from their finite shelf space to avoid such losses. They need to continuously replenish their products based on what is selling and what is not. This depends not just on the inventory at the back of the store but also on how not needing materials are handled.
When stores manage to not waste time on materials that are not required, it frees up time and effort to fulfil the store’s primary purpose — to capture demand and deliver a larger selection of needed products.
What is OTIF and why does it matter to CPG companies?
OTIF is one metric with two different components combined:
OTIF is a compliance program that was designed to ensure that products are on the shelf when and where they need to be. The OTIF metric offers a clear incentive for CPG companies to raise their score and meet demand.
Order to Delivery Cycle
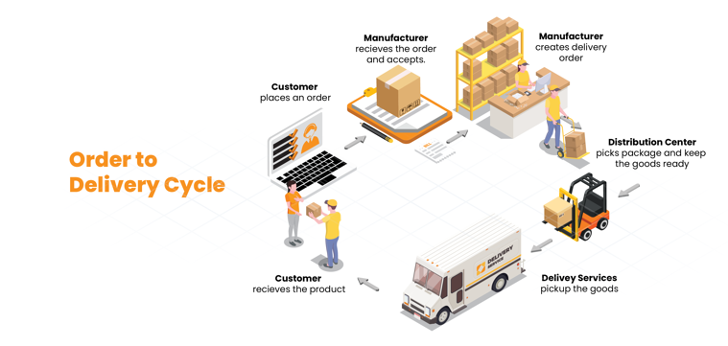
Supply chains for CPG companies that fail to achieve their OTIF goals can face hefty penalties based on the cost of the goods sold. Earlier, the supply chain would end with the distribution centre (DC) serving the physical store’s DCs. The companies did not have a clear view of the end-consumer demand, as they had to rely on syndicated data. Now, retailers are passing the end-consumer demand at stores to CPG companies. The companies will have to use this data to also focus on forecasting end-consumer demand more accurately.
This loss of inventory is a challenge for the CPG companies unless predicted correctly.
How advanced analytics can help improve OTIF based on Tiger Analytics’ experience
One of Tiger’s largest manufacturing clients had issues pertaining to achieving the OTIF metric across different customers. In addition to tracking the ongoing OTIF, they were also interested in understanding and taking action on the root causes behind OTIF misses. A real-time dashboard with prescriptive capabilities was developed, which enabled the customer management teams to grapple with the core issues behind the OTIF misses. Specific action against each of these root causes helped the client improve OTIF metrics significantly.
Objective
Initial exploratory analysis of the data pointed to varying patterns of OTIF percentages across different demand groups. The overall distribution showed that 18% of the Stock Keeping Units (SKUs) had less than 5% OTIF, which contributed to 25% of the lost sales.
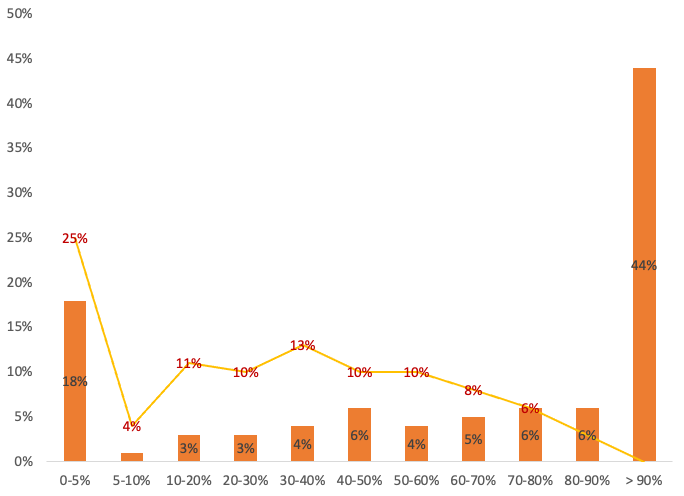
Distribution of OTIF percentage across the top 2 demand groups showed that Group 1 had 4% SKUs with an average of 40% OTIF and 25% lost sales, while Group 2 had 10% of SKUs with an average of 60% OTIF and 25% lost sales.
The model was built on a Demand Group * Material * Distribution Center formula for better results.
Data Sources
The model leveraged drivers based on historical data from different sources, including demand forecast, shipments, inventory, safety stock targets, carrier performance, DC performance, components, etc.
These were then transformed into actionable features such as net demand to forecasted demand ratio, shipped quantity to forecasted demand ratio, inventory to safety stock, inventory percentage change, shipped quantity to net demand, forecast error, customer carrier delay, percentage of demand delayed due to sales order management (SOM), the relative contribution of SOM on late shipment, and percentage of demand delayed due to pricing.
Machine Learning Algorithm
The features/drivers were built using data from the previous month and predictions were made for the subsequent month with a four-week lag to drive actionability. While Linear and Random Forest Regressor resulted in high bias, XGBoost Regressor gave more accurate predictions with less bias and lesser WMAPE (Weighted Mean Absolute Percentage Error). Since actionability was key, SHAP (SHapley Additive exPlanations) values were also generated for each SKU to understand top drivers and their direction of impact.
Real-time Dashboard
The algorithm was deployed, and the results were fed into a dashboard that refreshed monthly. In November 2021, the dashboard leveraged drivers from October 2021 with predictions for the month of December 2021. This way, the planners had a timeframe of 3–4 weeks to take necessary action.
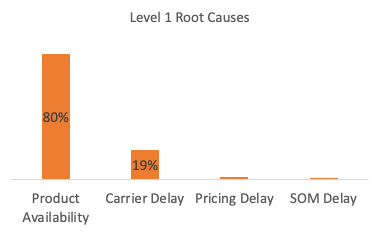
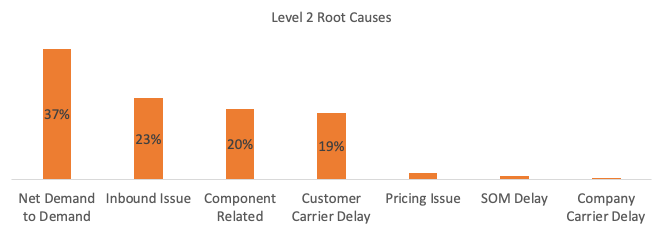
Predictions were identified for each SKU, as well as the aggregations available at different granularity — be it a distribution centre, business unit, demand group or at the SKU level. The dashboard also enabled planners to identify the different levels of root causes for each high-risk SKU. Product availability and carrier delays were found to be Level 1 root causes, while forecast error and Inbound issues were Level 2 root causes.
Conclusion
Order Delivery Performance provides an indication of how successful the supply chain is at providing products and services to the customer. A lack of visibility creates significant opportunities for error. Thus, manufacturing companies need a single point of data truth to reduce OTIF misses.
All the critical KPIs impacting Order Delivery Performance can be plugged into a machine-learning algorithm to understand specific drivers. While the algorithm determines the OTIF percentage, a prescriptive solution with specific root causes will help drive action.