

Clustering is the process of originating groups of data points based on their uniformity and diversity. It is generally used for unsupervised learning where there is no dependent variable. As there is no dependent variable in the unsupervised learning we could not use any regression or classification performance metrics on this because they all need a dependent variable to compare the predictions. In this article, we will be learning about different performance metrics for clustering and implementation of them. The major points to be covered in this article are listed below.

Table of contents
- Why not classification evaluation metrics?
- Silhouette Score
- Calinski Harabaz Index
- Davies Bouldin index
- Description of data
- How to use clustering evaluation metrics?
Let’s first understand why standard evaluation metrics can not be used in clustering.
Why not classification evaluation metrics?
Since in every classification evaluation metric either it is a confusion matrix or log loss there is a need for a dependent variable or target variable. As these evaluation techniques calculate the metrics based on observed and predicted values. This is the reason why any classification evaluation metrics can not be used to evaluate the performance of any clustering algorithms.
The evaluation metrics which do not require any ground truth labels to calculate the efficiency of the clustering algorithm could be used for the computation of the performance evaluation. There are three commonly used evaluation metrics: Silhouette score, Calinski Harabaz index, Davies-Bouldin Index.
Are you looking for for a complete repository of Python libraries used in data science, check out here.
Silhouette Score
To study the separation distance between the clusters formed by the algorithm silhouette analysis could be used. The distance between the cluster can be calculated by different types of distance metrics ( Euclidean, Manhattan, Minkowski, Hamming). Silhouette score returns the average silhouette coefficient applied on all the samples.
The Silhouette Coefficient is calculated by using the mean of the distance of the intra-cluster and nearest cluster for all the samples. The Silhouette Coefficient ranges from [-1,1]. The higher the Silhouette Coefficients (the closer to +1), the more is the separation between clusters. If the value is 0 it indicates that the sample is on or very close to the decision boundary between two neighboring clusters whereas a negative value indicates that those samples might have been assigned to the wrong cluster.
The formula is as follows:
(nc-ic)/max(ic,nc)
where,
ic = mean of the intra-cluster distance
nc = mean of the nearest-cluster distance
Calinski Harabaz Index
The Calinski Harabaz index is based on the principle of variance ratio. This ratio is calculated between two parameters within-cluster diffusion and between cluster dispersion. The higher the index the better is clustering.
The formula used is
CH(k)=[B(k)W(k)][(n−k)(k−1)]
where,
n = data points
k = clusters
W(k) = within cluster variation
B(k) = between cluster variation.
Davies Bouldin index
Davies Bouldin index is based on the principle of with-cluster and between cluster distances. It is commonly used for deciding the number of clusters in which the data points should be labeled. It is different from the other two as the value of this index should be small. So the main motive is to decrease the DB index.
The formula which is used to calculate the DB index.
DB(C)=1Ci=1kmaxjk,jiDij
Dij=di + dj dij
where,
Dij= within-to-between cluster distance ratio for the ith and jth clusters.
C = no of clusters
i,j = numbers of clusters which come from the same partitioning
Description of data
Dataset used in this article is survey data done by taking random samples of the population. This data has been taken from the kaggle repository which is mentioned in the references. It contains 8 columns which contain different information about the surveyee. The description of columns is mentioned below.
- Marital status: marital status of surveyee married and unmarried which has already been label encoded 0 and 1.
- Sex: male or female is labeled encode as 0 and 1.
- Age: age of the surveyee
- Education: There are different education level
- Income: Annual income of the surveyee
- Occupation: Any occupation or not
Sample

How to use clustering evaluation metrics
Till now we learned about all the theoretical parts of the different clustering techniques. Let’s see how to implement them on data. Before implementing them, we need to build a clustering algorithm.
Importing libraries:
import numpy as np
import pandas as pd
import matplotlib.pyplot as plt
import seaborn as sns
from sklearn.cluster import KMeans
from sklearn.metrics import silhouette_score,calinski_harabasz_score,davies_bouldin_score
Reading dataset and preprocessing:
df=pd.read_csv('clustering data.csv')
df.drop('ID', axis=1, inplace=True)
df['log_income']=np.log(df[['Income']])
df.head()
Transforming the income column because the salary could be in any currency. So we need to standardize the data for a non-biased output.
Finding the value of K in K-Means Clustering:
X=df[['Sex', 'Marital status', 'Age', 'Education', 'Occupation', 'Settlement size', 'log_income']]
se = []
sil_scores = []
calinski_score = []
davies_score = []
index = range(2, 7)
for i in index:
    kmeans = KMeans(n_clusters=i, random_state=42)
    labels = kmeans.fit_predict(X)
    se.append(kmeans.inertia_)
    sil_scores.append(silhouette_score(X, labels))
    calinski_score.append(calinski_harabasz_score(X, labels))
    davies_score.append(davies_bouldin_score(X, labels))

    print('Intertia at K =', i, ':', kmeans.inertia_)
    print("Silhouette Coefficient: %0.3f" % silhouette_score(X, labels))
    print("Calinski-Harabasz Index: %0.3f" % calinski_harabasz_score(X, labels))
    print("Davies-Bouldin Index: %0.3f" % davies_bouldin_score(X, labels))
    print("---------------------------------------------------------------")

In the above output for every value of k four evaluation metrics have been calculated, k is the number of clusters. If we take a number of clusters as 3 (k=3) the values will be,
WCSS (within the sum of squared error): 42744
Silhouette Coefficient: 0.616
Calinski-Harabasz Index: 4304.782
Davies-Bouldin Index: 0.563
Decreasing the WCSS is the key objective of K-Means clustering, but in addition to it, there are three valuation metrics that need to be taken care of. Silhouette coefficient should be nearer to +1, lower the value of DB index higher the performance. Let’s plot these values to have a clear vision about selecting the number of clusters.
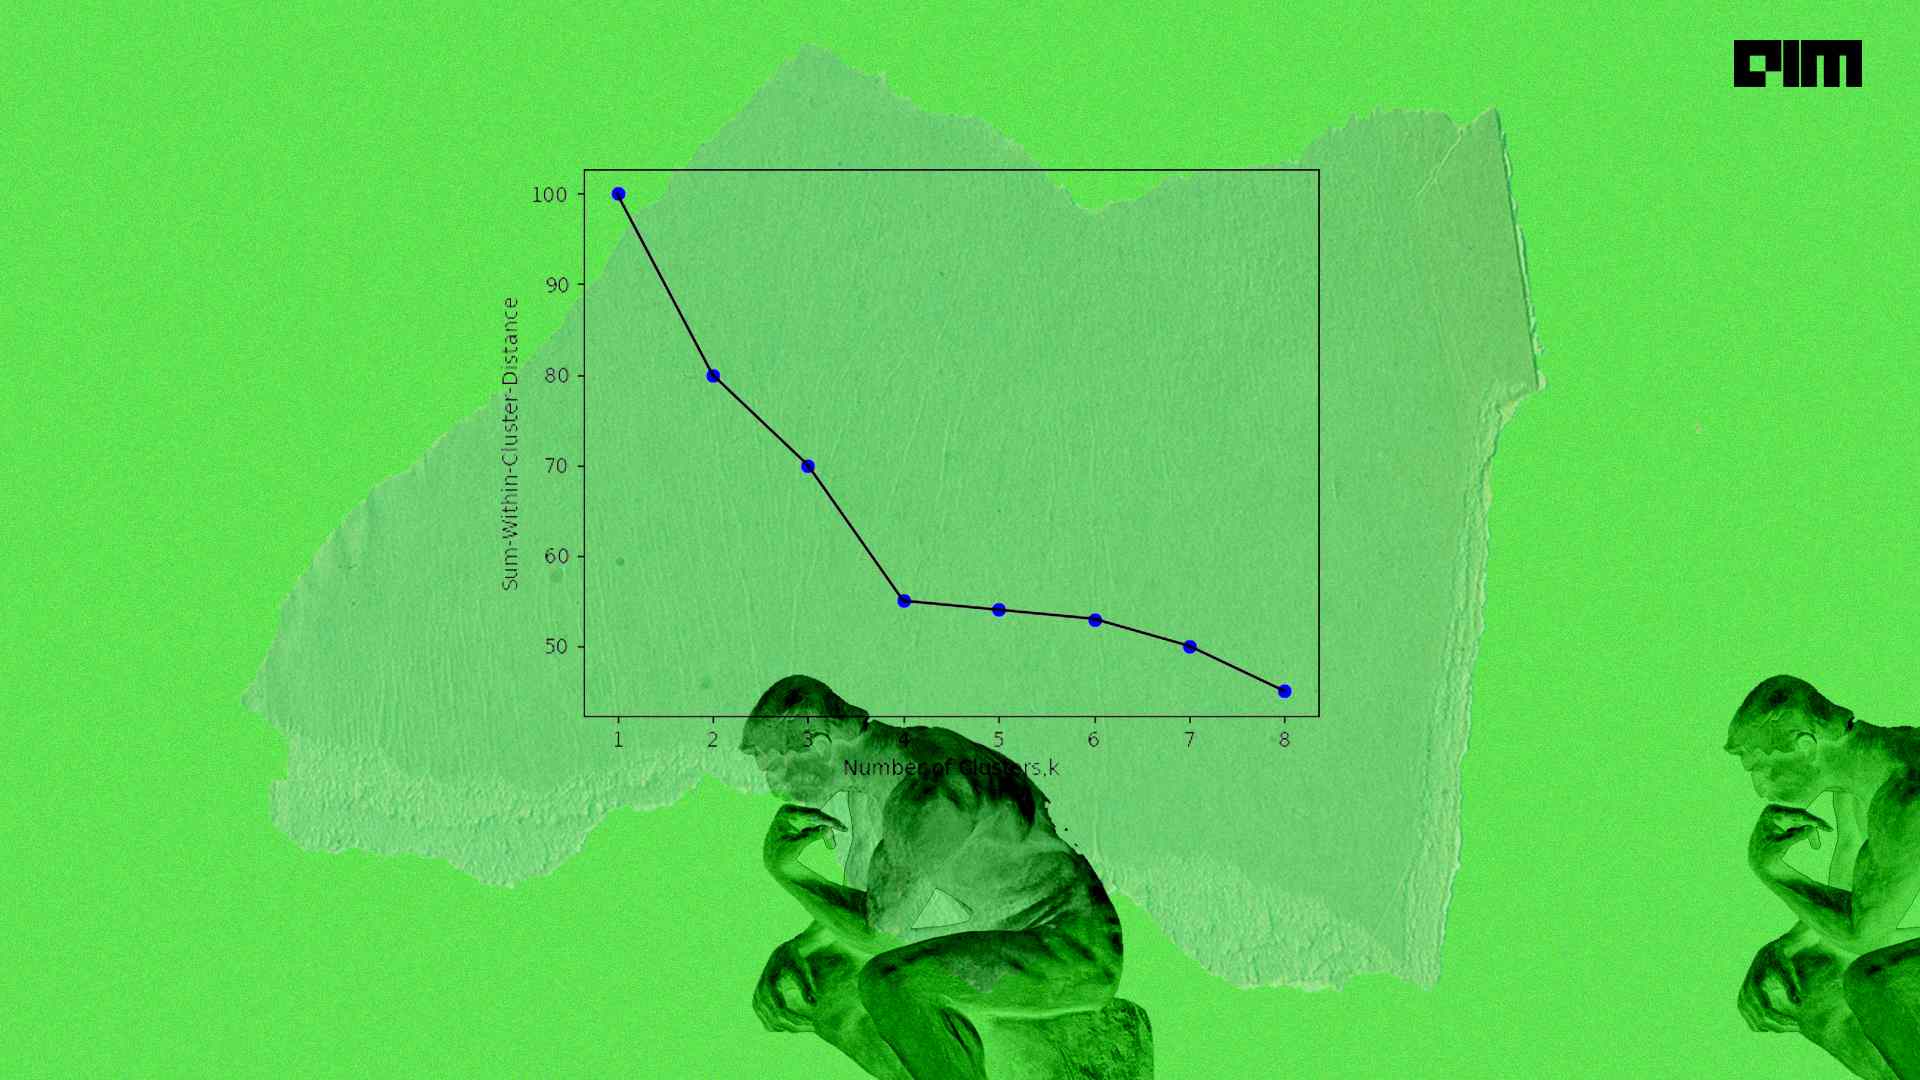
Plot Elbow curve:
plt.plot(index, se, marker='o')
plt.xlabel('Clusters')
plt.ylabel('With in Sum of squared error')
plt.show()


At k=3 a sharp point could be observed in the above graph. Hence we can move ahead with k =3. In the second plot which is the silhouette score plot, it could be observed that for k=3 the silhouette score for each label is above average( the red dotted line) and also the width fluctuation of every label is almost uniform and is not present in other plots. Hence k=3 is optimal.
Final model and evaluation metrics:
kmeans = KMeans(n_clusters=3, random_state=42)
labels = kmeans.fit_predict(X)

print("Silhouette Coefficient: %0.3f" % silhouette_score(X, labels))
print("Calinski-Harabasz Index: %0.3f" % calinski_harabasz_score(X, labels))
print("Davies-Bouldin Index: %0.3f" % davies_bouldin_score(X, labels))
Silhouette Coefficient: 0.552
Calinski-Harabasz Index: 5509.332
Davies-Bouldin Index: 0.566
Silhouette coefficient is 0.5 which is in the middle of 0 and 1 which is acceptable, DB index is also 0.5 which is in the middle but decreasing this would be better for the performance of the model, the CH index is high which is good. By these metrics, it can be concluded that the model is an average performer.
Conclusion
In this article, we have learned about theoretical as well as the practical implementation of different evaluation techniques for clustering algorithms and where to use these techniques. We have also gone through the implementation of these metrics with a real-world dataset.