Traders follow a simple motto: buy low and sell high. But when the opposite happens, the stock market goes berserk.
On a fine morning in 2012, the NYSE had to step in and cancel numerous trades due to erroneous trading by Knight Capital which saw the biggest drop ever since it went public. Instead of at least attempting to provide liquidity via limit trades, Knight’s algorithm acted as a market order.
Naturally, when the entire logic of trading was perverted courtesy of Knight’s busted algorithm, everything went chaos, and stocks went higher because they went higher, and the higher they went, the greater the incentive for the algorithm to keep pushing the stock higher.
In other terms, the algorithm bought high and sold low. This was clearly a scenario from the whole “what could go wrong” mindset in deploying advanced methodologies. Now, in 2019, machine learning algorithms are deployed aggressively in the finance and healthcare sector.
Whether it is the market crash or a wrong diagnosis, the after-effects will be certainly irreversible.
Tracking the development of machine learning algorithm throughout its life cycle, therefore, becomes crucial.
Life Cycle Of ML Models
The typical life cycle of deployment machine learning models involves a training phase, where a typical data scientist develops a model with good predictive based on historical data. This model is put into production with the hope that it would continue to have similar predictive performance during the course of its deployment.
But there can be problems associated with the information that is deployed into the model such as:
- an incorrect model gets pushed
- incoming data is corrupted
- incoming data changes and no longer resembles datasets used during training
Datasets used for natural language processing (NLP) are extremely sparse and need special techniques to detect divergence in feature patterns. Similarly, image datasets that typically use deep learning algorithms also need techniques that can detect divergence in incoming patterns.
The engineers at ParallelM propose MLHealth, a model to monitor the change in patterns of incoming features in comparison to the ones observed during training and argue that such a change could indicate the fitness of an ML model to inference data.
This eliminates the need for the availability of labels. There exist techniques such as KL-divergence, Wasserstein metric etc. that provide a score for the divergence between two distributions. However, they rely on the fact that the inference distribution is available and representative of the inference data. This implies there are enough samples to form a representative distribution.
Significance Of Similarity Scores
There are three pressing issues that Similarity scores aim to address:
- Low number of samples: since the Similarity score is calculated based on the parameters of the multinoulli distribution and does not rely on the inference distribution, it is agnostic of the number of samples
- Inference samples fall in a narrow range of training distribution:
Similarity score reply on the probability values associated with this narrow range of distribution and hence does not penalize the fact that inference distribution does not cover the entire range of categories observed during training
- The subset of patterns seen during inference might either have poor training coverage or good training coverage.
Similarity score is designed to tackle this scenario using the training probability values associated coverage scenario and not the good training coverage scenario.
In addition to a score for detecting potential drops in predictive performance, the system infrastructure must support such feedback, alert the mechanism and ideally handle the diversity of engines and languages typically used for ML applications (Spark, Python, R, etc.). a system that leverages this score to generate alerts in production deployments.
Architecture Of ML Health
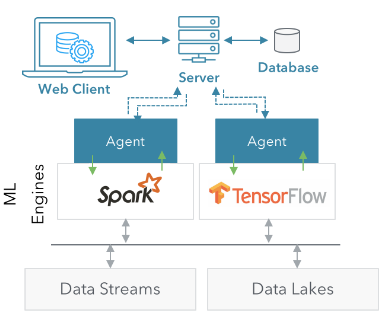
Source: Paper by ParallelM
At the core of this architecture is a Server and an Agent. The Server keeps track of all the deployments across agents, while the agents themselves are agnostic of all the jobs running in the system.
Users can leverage built-in applications and health metrics, create new applications and/or metrics, or import their existing ML pipelines and health-metric computations using any of the popular programming languages.
Datasets Used
The results were taken by running the model on three publicly available datasets
(a) Human Activity Recognition (Samsung)
(b) Video Transcoding Time [20] and
(c) TELCO
Samsung is an activity recognition dataset with 6 classes as labels. It consists of 560 features. Video dataset has video transcoding time as the label and consists of 10 is a binary classification dataset with SLA violations as the label. It consists of 24 Features.
Activity and Video datasets are used as is without normalization. Random forest classification and regression are used respectively for the Activity and Video datasets. These datasets are divided into train and test using random shuffling. The sources of these datasets do not claim to provide varying distributions.
TELCO dataset inherently consists of different loads seen in the network. Ideally, this should be reflected in the data-deviation scores.
Know more about the research here
Key Takeaways
- Similarity score performs consistently well in the presence and absence of noise agnostic of the number of samples present in inference. This is demonstrated by the results across three datasets, briefly described below.
- Similarity score shows the highest correlation with the predictive performance of the algorithm/model when a small number of samples are present in the incoming data across the three datasets.
- Similarity score shows a high correlation with the predictive performance of the algorithm/model when the nature of incoming data changes and the number of samples is small. This is demonstrated using the TELCO dataset across three different loads.
- All the data deviation scores perform equally well when there is data corruption, irrespective of the number of samples in the incoming data across all three datasets.