World Health Organization declared COVID-19 as a pandemic on March 11th, 2020. The outburst of cases reported globally since then has severely grown, impacting the day-to-day life of both organizations and individuals across the world. It is now imperative to understand how long the pandemic might last and find effective ways to flatten the progression of COVID-19 cases.
Research literature covers various statistical models (such as Gamma distribution, Negative Binomial distributions) and epidemiological models (such as SIR, SEIR) that are used to make predictions about the number of people infected with contagious diseases such as Ebola, SARS, MERS. However, the research on transmission rate, incubation period and other parameters that go into mathematical modelling of the spread of COVID-19 is still at a nascent stage with most of it yet to be peer-reviewed.
Hence, standalone epidemiological models may not suffice to forecast the spread of Covid-19. Furthermore, these parameters may vary by region and intervention steps taken by various governments like social distancing, school closures, complete lockdowns and so on. In this article, we present an ensemble predictive solution that combines an epidemiological model and various Machine Learning (ML) techniques to forecast the impact of the COVID-19. The solution also incorporates the intervention steps taken by various governments to curb the impact.
Introduction
Frequently used methods for forecasting the growth of any infectious disease include the use of epidemiological models. We showcase two such commonly used epidemiological models in the figure below:
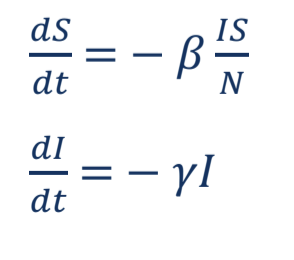
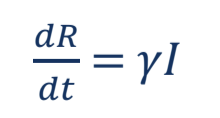
- SIR Model – As shown in Fig. 1, ‘S’ indicates the proportion of a population that is Susceptible, ‘I’ is the number of Infected persons and ‘R’ represents the number of Recovered patients. N is defined as the sum of ‘S’, ‘I’ and ‘R’, which is constant and taken as the total population of the forecast region. SIR model can be represented by the equations below:
- SEIR model – ‘S’ indicates the proportion of population that is Susceptible, ‘I’ is the number of Infected persons, ‘R’ is proportion of Recovered patients and ‘E’ indicates the individuals who have been exposed to the disease but are not infectious. SEIR Model can be represented by the equations given below:
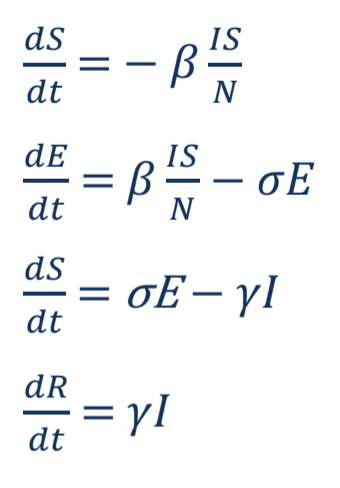
In the equations for both models, the infectious rate is denoted by β and is representative of the probability of disease transmission between susceptible and infectious persons. Similarly, the incubation rate of the disease is represented by σ and the patient recovery rate is represented by γ.
- SIR model
- SEIR model
Figure 1 – An illustrative depiction of the traditional a. SIR and b. SEIR models
Covid-19 Disease Forecasting Solution
In this section, we delve deeper into Genpact’s forecasting solution. The solution involves three main steps:
- Building the SIDR Model: A solver is built for the set of differential equations that represent the SIDR model (Susceptible-Infected-Dead-Recovered) using TensorFlow (TensorFlow Probability library) and initial parameters for the epidemiological model.
- Quantifying Interventions: The impact of interventions such as lockdowns and social distancing regulations, from government authorities are dynamically incorporated into the model.
- Error Minimization using ML: A multi-objective machine learning model is built using Adam’s Optimizer from TensorFlow to identify the cases, deaths and recovery curves that best fit the actual curves reported so far.
SIDR Model
The modified SIR Model (i.e. SIDR) enables the modelling of progression of COVID-19 cases using daily updated data of confirmed cases, deaths and recoveries as reported on the Johns Hopkins University’s (JHU) website. In addition, the parameters for each of these attributes were calculated using a Machine Learning (ML) model. Based on the data from JHU, the following attributes were included in the forecasting methodology:
- Number of Confirmed COVID-19 cases in each state in the US
- Number of Deaths from COVID-19 in each state in the US
- Number of Patients who Recovered after contracting COVID-19 in each state
In the proposed model, we chose not to use SEIR as the epidemiological model because the data and research on the Exposed component (number of individuals who are exposed but not currently infectious) is relatively unknown.
The solution instead uses ‘the SIR model with an added variable D’ – with D representing the number of Deaths from COVID-19. Accounting for deaths, the system of Ordinary Differential Equations (ODE) used in the solution are given below:

The f in the system of differential equations (on left) signifies the percentage of infected people who will die from the infection. It can be shown mathematically that the system of ODEs on the left is equivalent to the system of ODEs on the right, which can thus be used to model deaths and recoveries independently.
Figure 3 – COVID-19 ML Model Workflow using SIDR epidemiological Model
The methodology then involves minimizing the simultaneous error for confirmed cases, deaths and recoveries between the time series projected using SIDR model and the time series from actual data. Thus, the parameters – infection rate, death rate and recovery rate are trained using the machine learning model.
Modelling the Impact of Lockdown and Interventions.
Once the actual progression was modeled using the SIDR methods, the errors in the forecasted infected rate, death rate and recovery rate are minimized using a multi-objective minimization function. The interventions mandated by governments across the world (such as lockdowns, social distancing, school & bar closures etc.) impact the movement of people in a region. Since the decrease in mobility in a region is directly co-related to interventions, the coronavirus does not spread at the same rate as before said interventions are imposed. Thus, the model was designed to use location mobility data to forecast the progression of COVID-19 to dynamically account for government interventions.
The model assumes that under lockdown, the rate of infection decreases exponentially with time. Two separate dates defining the Intervention start date and Lockdown start date were calculated from mobility data (% change in movement across the region). Threshold point for Intervention date was taken when mobility goes down by atleast 30%.
The following equation was used to incorporate the effects of lockdowns and social distancing in the model:
Where 1 & 2 are decay parameters trained by the model, ti & tl are dates at which intervention & lockdown starts
Therefore, the term β in the SIDR model is not a constant, but rather, a time-dependent variable modelled by α1 and α2. The model can also backtrack through real world data to forecast scenarios of infection, death and recovery rates, had the lockdown measures in a state, started 2-3 weeks before the actual implementation. Additionally, the model can also forecast situations such as cases where lockdowns are lifted after 2-3 weeks, in the future.
The solution projects several variables including – identification of the peak and recovery curves, confirmed cases, deaths and recovery rates, in each region. The solution was developed for each of the 50 states in the US and is expandable to all regions of the world.
Results
In this section, we present the spread of COVID-19 disease in one of the states (Connecticut) in the US. The model was trained on historical data (12th march – 25th April 2020) of confirmed cases, deaths and recoveries, to forecast the disease progression in the next 45 days (till 9th June 2020). The measure of accuracy used for training the model was the weighted Mean Absolute Percentage Error (MAPE) on confirmed cases, deaths and recoveries, thus acting as a multi-objective minimization function. For the unseen period – the future forecast for confirmed cases, resulted in one week out and two weeks out MAPE, of 12% and 15% respectively.
Fig. 4 shows the curves for actual daily COVID -19 cases versus forecasted daily cases till 25th April 2020 to understand how forecasted cases are aligned with actual cases. Fig. 5, Represents the daily actual deaths versus forecasted deaths till 25th April 2020. Fig. 6, Represents the daily actual recoveries versus forecasted recoveries till 25th April 2020. Fig. 7, shows forecasted daily confirmed cases to represent the progression of disease in Connecticut. The curve shows that the disease will peak from mid-April to mid-May and gradually come down by the end of June. It also shows the deaths and recoveries, which are projected to increase towards the end of June due to incubation period of the virus and time spent in hospitals after getting an infection.
Potential Application Areas
The COVID-19 forecasting Model is highly useful in use cases such as:
- ICU Bed and Ventilator Forecast – Due to the rapidly increasing number of confirmed cases of COVID-19 and most governments across the world trying to ‘flatten the infection rate curve’, the availability of Intensive Care Unit beds has become critical. Forecasting the number of available ICU beds and ventilators will give hospitals an idea of how they can treat incoming patients and avoid high mortality rates and reduce the duration of hospitalization critical patients. The solution can help with identifying possible number of new infection cases in a region and forecast number of ICU/ventilator requirements might arise.
- Employee Risk Assessment – The model can also be input with other publicly available resources for the virus’ spread and data related to the sites and locations of a company. This will help the firm predict the risk of an employee getting exposed to the coronavirus. Additionally, the model can be dynamically improved by adding employee information such as demographics and other external lifestyle data predict the impact on the firm’s sales, operational capacities.
- New Normal Business Outlook – The COVID-19 pandemic is drastically altering customer demand for products. The solution can be applied to forecast customer demand to predict new consumer behavior or how sales volumes will change when economic activity resumes in the recovery period post the pandemic. The solution can also help businesses evaluate best practices for the new normal ways of functioning in the post COVID-19 world, by developing a demand sensing model linked to external indicators.
Authors
Mohit Makkar: Data Science & Insights at Genpact | Bangalore, India
mohit.makkar@genpact.digital
Omprakash Ranakoti: Data Science & Insights at Genpact | Bangalore, India
omprakash.ranakoti@genpact.digital


