

Big Data comes along with its complications. Collecting and managing data properly and the methods used to do so play an important role. With such underlying concerns, the method of Data Preparation becomes very helpful and a crucial aspect to begin with. A good data preparation procedure allows for efficient analysis, limits and minimizes errors and inaccuracies that can occur during processing, making the processed data more accessible to all users. Lately, the process of Data Preparation has gotten easier with new tools and technologies that enable anyone to cleanse and clarify data independently. Data preparation is the process of cleaning and transforming the raw data before preprocessing and analysis. It is a small yet important step before processing and often involves reformatting the data, making corrections, and combining multiple data sets to enrich the present data. Data preparation is often considered a lengthy undertaking for data professionals or business users, but it is an essential prerequisite to put data in context to turn it into insights that might help in decision making, eliminating the bias resulting from poor data quality.
The data preparation process first begins with finding the right data. This can come from an existing data catalogue, warehouse or can be added ad-hoc. After the data is collected, it is important to discover and explore each dataset to prepare and process. This step is essential and helps get to know the data and understand what has to be done before the data can be called useful in a particular context. Cleaning up the data is traditionally another most time-consuming part of the data preparation process, but it’s crucial for removing forward and dealing with faulty data to help fill in the gaps present. Data cleansing is a process where you go through all of the data to be processed and either remove or update information that is considered to be incomplete, incorrect, improperly formatted, duplicated, or highly irrelevant. The Data cleansing process usually also involves cleaning up all the data compiled previously in one area. The data cleansing process is done all at once and can take quite a while if the information has been piling and stacking up for years. That’s why it’s important to perform data cleansing and taking care of the data regularly.
Then, data is further transformed by updating the format or value entries to reach a clean and well-defined outcome or to make the data more easily understood by a wider spectrum of audiences. Once all the mentioned processes are done, the data is prepared. This data can be stored or inculcated into a third-party application, such as a business intelligence tool, clearing the way for processing and analysis. A thorough data preparation process can give an organization many advantages and rather give it a headstart. It must be clean and free of errors before using data for analysis or plugging it into dashboards for visualizations. Preparing data for analysis will help avoid mistakes, saving more time to be invested down the line. These errors will be much more difficult to catch and fix after the data has been transferred out of its original format. Using properly cleaned and formatted data while building data models or applications will ensure top-quality reporting and analysis with proper accuracy. This eventually helps receive game-changing and revolutionary business insights.
What is DataPrep?
DataPrep is an open-source library available for python that lets you prepare your data using a single library with only a few lines of code. DataPrep can be used to address multiple data-related problems, and the library provides numerous features through which every problem can be solved and taken care of. Using the DataPrep Library, one can collect data from multiple data sources using the dataprep.connector module, perform intense exploratory analysis using the dataprep.eda module and clean and standardize datasets using the dataprep.clean module. DataPrep automatically detects and highlights the insights present in the data, such as missing data, distinct count and statistics. A whole detailed profile report can be created in a matter of seconds by using just a single line of code, which makes it ten times faster than other libraries to perform data preparation or EDA on.
Getting Started with the Code
In this article, we will be exploring the different functionalities of the DataPrep library for ease in Data Preparation and EDA, which will help us understand the library even better. The following implementation is partially inspired by the official DataPrep Documentation, which can be accessed using the link here.
Installing the Library
To install the library, you can use the following line of code,
# Run the code to install DataPrep
!pip install dataprep
Installing the Dependencies
Further, from the DataPrep library itself, we can import the required dependencies for the task to be performed,
import pandas as pd
from dataprep.eda import plot, plot_correlation, plot_missing
As we want to create different plots from our dataset, we have imported plot, plot_correlation to create correlation graphs,plot_missing to plot the number of missing data.
Now, Lets load our data into the data frame,
#loading data in to the DataPrep dataframe
df = pd.read_csv("/content/master.csv")
Creating Visualizations
Using DataPrep, we can create all the possible visualizations for the data using just a single line of code. Let us plot our loaded data and see what it looks like,
df["year"] = df["year"].astype("category")
plot(df)

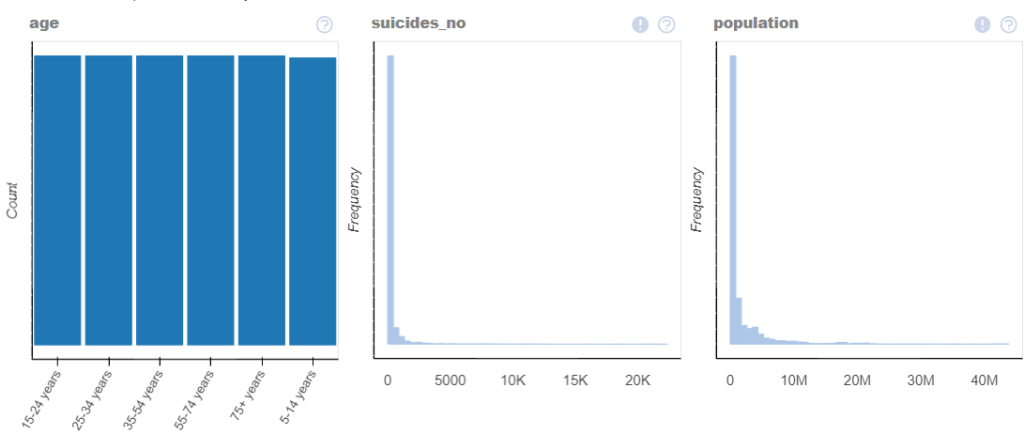
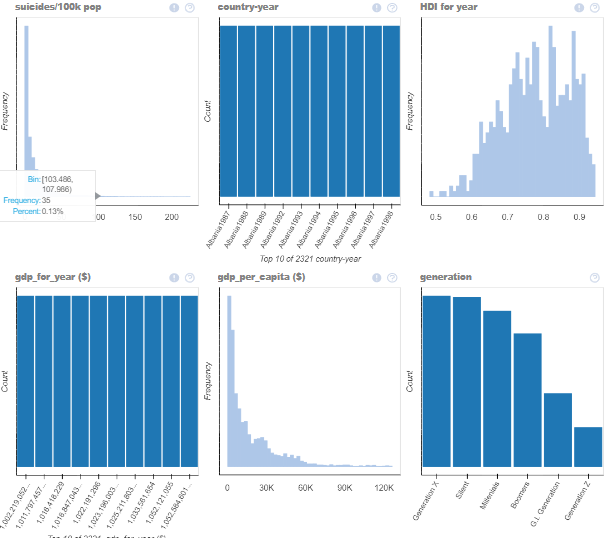
As we can see, the library itself detects the data and plots all the necessary data graphs in a single-window itself!
Auto Insight Generation
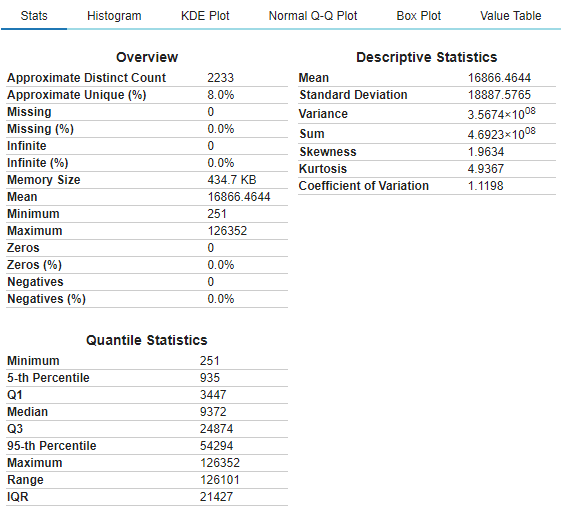
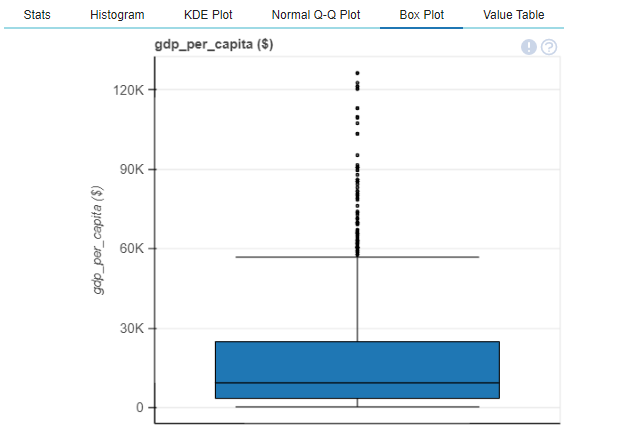
You can also get a detailed plot for a single column with all its statistics to understand the column better,
plot(df, "gdp_per_capita ($)")

We also create a dataframe, taking care of the missing values and then create a correlation plot,
df_without_missing = df.dropna('columns')
plot_correlation(df_without_missing)
plot_correlation(df_without_missing, k=1)
plot_correlation(df_without_missing, value_range=(0,1)

Whether it be Pearson, Spearman or Kendall-Tau, any correlation graph can be easily plotted using the DataPrep library.
More Operations with DataPrep
Let us now explore some more operations on another dataset. Here I have used the titanic dataset to perform further functional operations on using DataPrep.
Exploring the missing data in the dataset,
#plot missing
plot_missing(train_df)
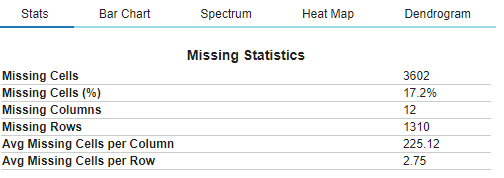
DataPrep will automatically analyse the data and provide the necessary graph such as a Bar Chart, Heat Map or a Dendogram.

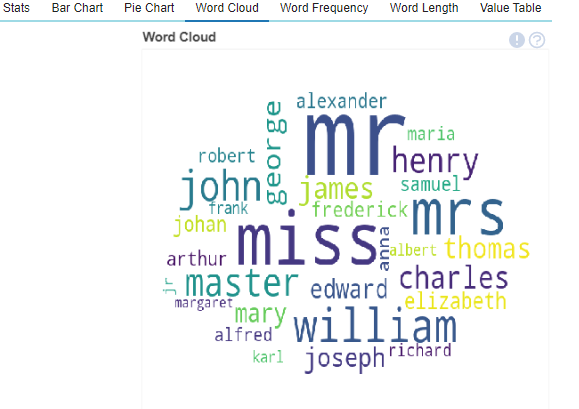
Creating Word Clouds have never been easier as well, such functionalities can be used in NLP tasks which will be highly helpful.
plot(train_df,'name' )
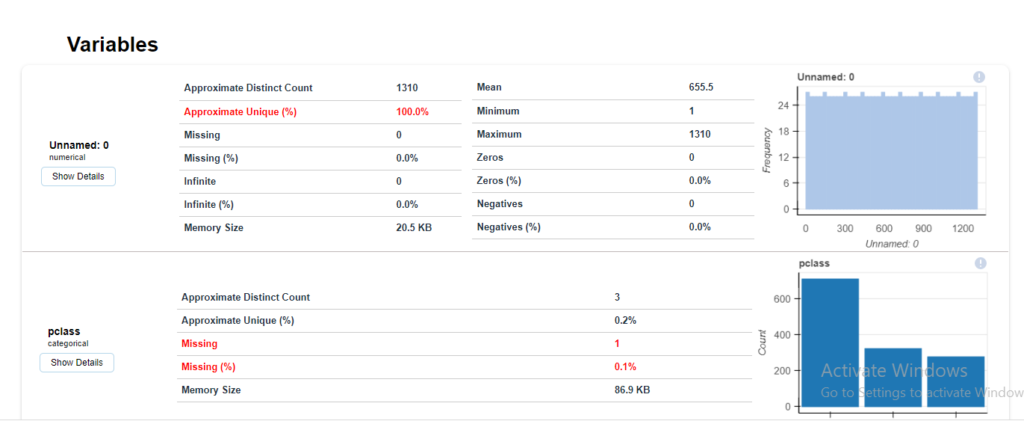
To further analyse and understand what necessary steps would be needed to take on the loaded dataset, we can generate an instant report of the dataset in one go, which will provide us with all the necessary information and metrics to analyse where the focus during the data preparation stage must be, particular columns if any.
#creating a full report
create_report(train_df)

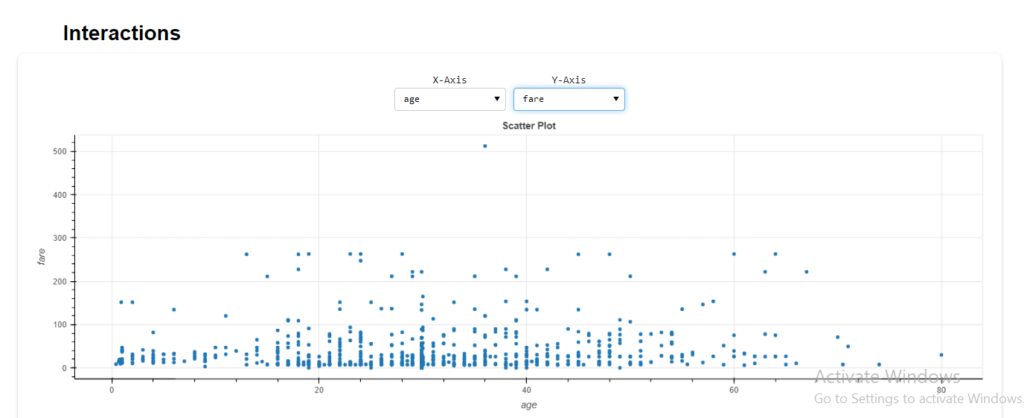
The detailed statistics for each column is generated with options to perform interactions between columns, check correlation or plots of missing values.
End Notes
In this article, we understood the importance of Data Preparation in Big Data Analytics and the necessary steps required to do so. We also explored a library known as DataPrep, and tested its different functionalities that might help during the Data Preparation and EDA phase. Although there is still a lot more the DataPrep library can do, I would recommend encouraging the reader to explore further and understand the library’s immense power. The following implementations above can be found as Colab notebooks in two separate notebooks. You can access them using the links here: Notebook 1 – Titanic Dataset Notebook 2.
Happy Learning!