Web development is the term that stands for creating, deploying and operating web applications and conceptualizing application programming interfaces for the World Wide Web. The Web has grown tremendously during the past decade, raising the count in the number of sites, users, interface and implementation capabilities since the first website went live in 1989. Web development is the concept that comprises all the activities involved around websites and web applications. For example, python can be used to build and implement server-side web-based applications. While a web framework is generally not required to build web apps, Python developers write their web applications these days using a combination of Python and JavaScript, where Python is executed on the server-side. At the same time, JavaScript is downloaded to the client and run by the web browser.
Frameworks are the foundation of web development. Choosing one largely depends on the type of app, you intend to develop. A Web framework is a collection of packages and modules that allow developers to write Web applications and services without handling basic and low-level details such as protocols, sockets or process and thread management. When using a framework, a developer typically writes code with conventions that let the developer “plug in” into the framework, delegating responsibility for the communications and infrastructure. At the same time, he can concentrate on the logic of the application using his code.
The “plugging in” aspect of Web development is often seen as opposition to the classical distinction between programs and libraries. Frameworks make it easier for creators and developers to reuse code for common HTTP and web-based operations and to structure projects so other developers with knowledge of the framework can quickly build and maintain the application. In addition, frameworks help automate common solutions, giving the users the flexibility to focus on the application logic.
Python as a language is currently the buzz and is at the height of popularity for creating developments. Being simple and versatile, it serves as a fit for implementations in areas like web development, data science, DevOps, and more. Python-based web frameworks are a choice for many companies, including Netflix, Instagram, and Dropbox. Such highly loaded sites that process millions of user requests per day use Python-based Web Frameworks as the central developing applications and sustaining their top-notch performance.
This article will discuss two of the most popular Python frameworks for developing web applications, Streamlit and Plotly Dash.
What is Streamlit?
Streamlit is an open-source Python library that provides development components to create and share beautiful and easy to use custom web applications for machine learning and data science. Streamlit is a data app framework that can also be used as a data dashboarding tool. Using just a few lines of code, one can build and deploy powerful data apps in a matter of a few minutes. The framework is growing very quickly in popularity among the people within the data community, accruing more Github Stars than any other data app framework except Plotly Dash. The most unrivalled thing about Streamlit is that it does not require any prior detailed knowledge of web development. If one knows Python Language, no extra skills are further required. Streamlit’s user interface is more structured and focused more on simplicity which aids in ease of use.
It generally supports only Python-based data analysis but seems to have a limited set of widgets, such as sliders to choose from. Data apps such as Streamlit provide a fantastic way for data scientists to present their results. They can give the audience an interactive control of visualizations, engaging the user more intuitively with the narrative and helping in a deeper understanding of the presented subject. Data app frameworks like these are code-based, which allow for more complexity than the BI dashboarding tools. Streamlit’s API design is filled with elegance and simplicity. Start with defining a simple hierarchy of layout containers such as the reactive sidebar, which gets included automatically, then plots and control widgets with numerous style commands can be added.
Further elements to appear in the layout container in the code order unless otherwise specified. Streamlit tends to re-run the whole Python script code whenever any app changes its state. This enables running applications quickly without the need for custom callback functions. Unfortunately, sharing applications through Streamlit is rather limited. Developers are limited to only three apps, even for open source projects. Apps can run only on an online interface of a single CPU with less than 1GB of RAM and storage provided, so many modern machine learning use cases are not feasible. Although most industry data science projects are not open source, so Streamlit Sharing is a non-starter.
Streamlit can be deployed in the following way :
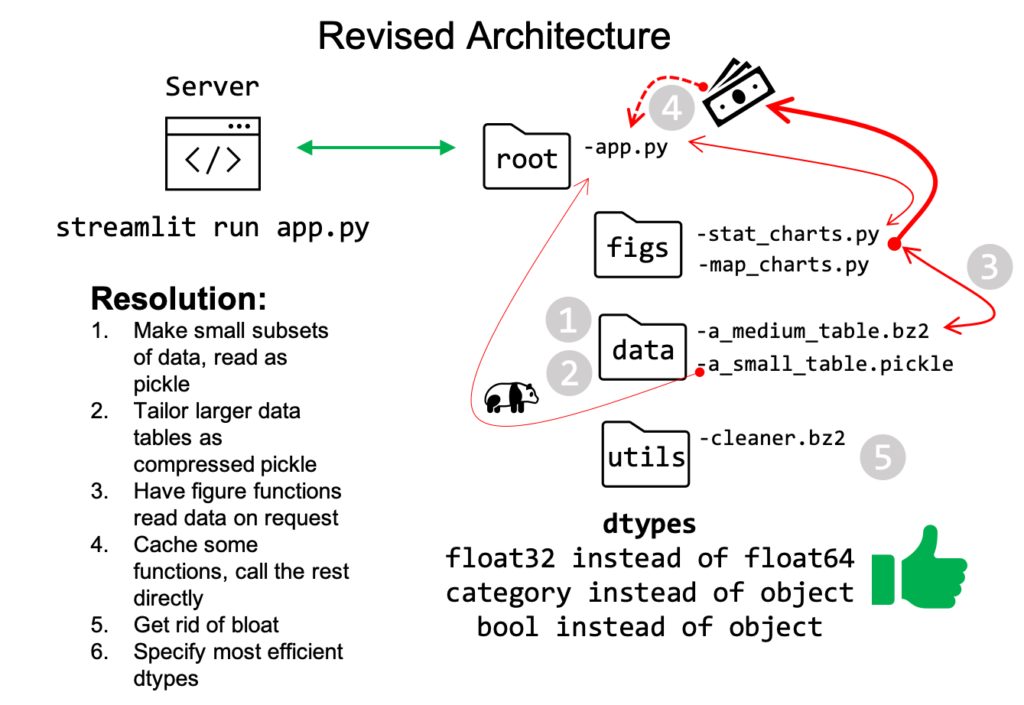
Setting Up Streamlit :
Streamlit can be set up on a system very easily with simple steps. The official Streamlit documentation has inspired the following set of codes and execution. You can access and read the official documentation from the link here.
Getting Started
Before installing the Streamlit library, you might need one of the following environments to execute it properly and access all the functionalities. You should have the following installed on your system :
- Python Version 3.6-3.8
- Python IDE
- Conda
- Pipenv
Installing Streamlit
To install Streamlit into your system, you can run the following command,
pip install streamlit
Now, you can further run a hello world app to make sure everything is setup and running correctly,
streamlit hello
Importing Streamlit :
After everything is installed, we can start with working by performing some necessary steps. Here, we will create a new Python script and then import Streamlit and other dependencies.
To do so first, we will need to :
- Create a new Python file with any desired name; mine will be victor_app.py and save the file.
- Then open the created file with your installed IDE or text editor.
- Next step, import Streamlit and the required dependencies.
 import streamlit as st
 import numpy as np
 import pandas as pd
The created application can now be executed. You can run your app using the following command. A new tab will then open in your default browser. It’ll be blank for now, but you can add things further.
streamlit run victor_app.py
You can add title to your data with the following command,
st.title('Victor’s first app')
You can create a data frame and write to your app without calling any Streamlit methods. Streamlit supports a set of internal commands known as “magic commands”. You can define the data frame using the following set of commands,
 df = pd.DataFrame({
   'first column ': [1, 2, 3, 4],
   'second column' : [10, 20, 30, 40]
 })
 df
With the use of st.map()command, you can add a map and display data points on a map. Here we will use Numpy to generate some sample data and plot it on a map of San Francisco.
 map_data = pd.DataFrame(
     np.random.randn(1000, 2) / [50, 50] + [37.76, -122.4],
     columns=['lat', 'lon'])
 st.map(map_data)
What is Plotly Dash?
Dash by Plotly is an Open Source Python library for creating interactive and responsive Web-based applications. Dash started as an open to the public concept on GitHub 2 years ago. The created prototype was available to use online, and subsequent improvements based on user interactions and implementations on Dash were inculcated. In addition, user feedback from private trials at banks, labs, and data science teams helped the product improve forward. Dash is a highly productive Python framework for building analytic web applications. It is written on top of Flask, Plotly.js, and React.js. As a result, dash comes across as an ideal tool for building and implementing data visualization apps that can be integrated with highly custom user interfaces coded in pure Python language. It’s particularly very well suited and can be used for anyone who works with data and analytics using Python.
The created Dash apps get rendered in the web browser installed at the point of time in the system. One can easily deploy the created apps to servers and then share them to view and interact through URLs. Since Dash apps are viewed in the web browser, Dash can be termed as cross-platform and mobile-ready. The Dash open source library has been released under the permissive MIT license. It provides and comes with a series of ready to use components and widgets that can be included while creating an application, such as Sliders, Checkboxes, Dropdown Menus, Textareas, to name a few. Dash applications created can be embedded anywhere using the Dash Enterprise Embedding Middleware. Whether it be a React application, static website, or Chromium desktop app, every variety can be embedded using the Dash framework.
Dash is a library that can aid in creating analytical web applications. Data Science Professionals who use Python for data analysis, data exploration, visualization, modelling, instrument control, and reporting will find an interesting use of Dash. Dash makes it very simple to build a Graphical User Interface around the data analysis code being implemented. An example of a basic GUI Dash App can be implemented around with a Dropdown and a D3.js Plotly Graph. As the user selects a value in the Dropdown, the application code dynamically exports data from Google Finance into the Pandas DataFrame. Such implementations can be created with minimal coding using the Dash framework. Dash Open Source, for community use, and Dash Enterprise for Organizational use purposes are two versions of Dash.
Here is one way that a created application works on Dash Enterprise Version :
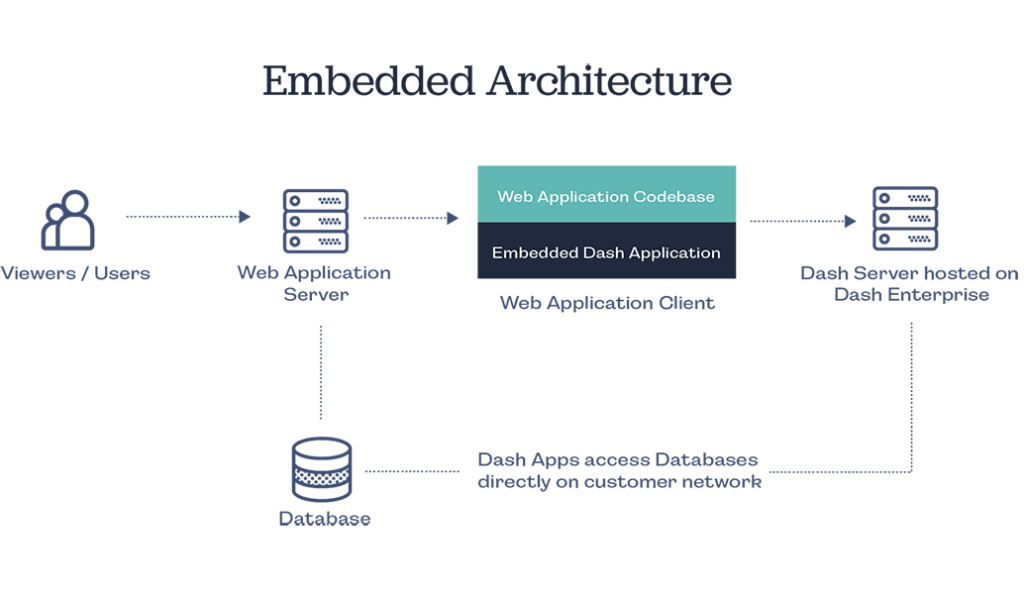
- Users and viewers can access the Dash web application server.
- The server then redirects the users or viewers towards the Web application Codebase or the Embedded Dash Application.
- The database for the application created is then accessed, and the application directly provides access to the data on the customer network.
- The Dash server is hosted on its server known as the Dash Enterprise, and the application can be viewed and interacted with.
Getting started with Dash
To get started with the Dash application framework using Python, we would first require to install the library for Dash. The following codes and execution were inspired from the official Dash documentation, which can be accessed and read using the link provided here.
Installing The Dash Library
The Dash library for implementing on a Python environment can be done using the following code,
pip install dash
To install the Dash library to be used in a Jupyter Notebook, the following code can be implemented,
pip install jupyter-dash
Next up, you can install further dependencies for analysis,
 import numpy as np
 import pandas as pd
Creating a basic Dash Application
To create a basic dash application, we will first have to create a python file with codes to access the Dash framework. Here, I will create a .py Python Language file named victor.py, with the following code. We will be implementing a bar chart using Dash.
Importing the Dependencies
We will further import the required dependencies for creating our application.
 import dash
 import dash_core_components as dcc
 import dash_html_components as html
 import plotly.express as px
 import pandas as pd
Importing the required stylesheet, you can use any
external_stylesheets = ['https://codepen.io/chriddyp/pen/bWLwgP.css']
Creating our Application,
 app = dash.Dash(__name__, external_stylesheets=external_stylesheets)
 # assume you have a "long-form" data frame
 # see https://plotly.com/python/px-arguments/ for more options
 df = pd.DataFrame({
     "Fruit": ["Apples", "Oranges", "Bananas", "Apples", "Oranges", "Bananas"],
     "Amount": [4, 1, 2, 2, 4, 5],
     "City": ["SF", "SF", "SF", "Montreal", "Montreal", "Montreal"]
 })
 fig = px.bar(df, x="Fruit", y="Amount", color="City", barmode="group")
 app.layout = html.Div(children=[
     html.H1(children='Hello Dash'),
     html.Div(children='''
         Dash: A web application framework for Python.
     '''),
     dcc.Graph(
         id='example-graph',
         figure=fig
     )
 ])
 if __name__ == '__main__':
     app.run_server(debug=True)
After saving the Python code in the .py file, we can run it on the terminal using the following command,
$ python victor.py
Running the command will redirect to the following address on the web browser :
http://127.0.0.1:8050/
Where it will show us our output for the implementation,

EndNotes
In this article, we have tried to explore and know about two of the most popular Python frameworks for developing web applications, Streamlit and Plotly Dash and how they work. We also tried to know how we can create basic applications using these application frameworks. Finally, I would like to recommend that the reader explore their numerous capabilities and uses to create beautifully engaging and interactive applications.
Happy Learning!


