Automatic classification techniques, also known as clustering, aid in revealing the structure of a dataset. PyClustering is a Python and C++ open-source data mining package that offers a variety of clustering techniques and approaches, including bio-inspired oscillatory networks. PyClustering is primarily concerned with cluster analysis to make it more accessible and clear to users. This article will cover different types of modules offered by pyclustering and implement an algorithm that pyclustering supports. Following are the topics to be covered.
Table of contents
- About PyClustering
- Modules in PyClustering
- About OPTICS
- How to Implement OPTICS using Pyclustering?
Let’s start by talking about PyClustering as a package
About PyClustering
The PyClustering library is a data mining package for Python and C++ that focuses on cluster analysis. To ensure optimal efficiency, the C++ half of the library is utilised for processing by default. This is especially true for algorithms based on oscillatory networks, the dynamics of which are regulated by a set of differential equations. If a C++ compiler is not found, PyClustering defaults to pure Python implementations of all kernels. PyClustering uses the NumPy module for array operations to improve the speed of Python implementations.
PyClustering provides efficient, parallel C++14 clustering solutions. Threading is given via a single thread of operation on most platforms, with the Parallel Patterns Library utilised for Windows. Because of the standardisation of these threading libraries, PyClustering is straightforward to implement into existing projects.
PyClustering’s main Python requirements are NumPy and SciPy, with MatPlotLib and Pillow necessary for visualisation functionality. The visualisation feature includes 2D and 3D plots of cluster embeddings, picture segments, and graphs of synchronisation processes in the case of oscillatory networks.
Are you looking for a complete repository of Python libraries used in data science, check out here.
Modules in Pyclustering
There are five modules in pyclustering clusters, n-net, g-colour, and containers.
Clustering Algorithms
Algorithms and methods are located in the Python module “pyclustering.cluster”. There is a list of clustering algorithms which is supported by Pyclustering.
- Agglomerative
- BANG
- BIRCH
- BSAS
- CLARANS
- CLIQUE
- CURE
- DBSCAN
- Elbow
- EMA
- GA – Genetic Algorithm
- HSyncNet
- K-Means and K-Means++
- K-Medians and K-Medoids
- MBSAS
- OPTICS
- ROCK
- Silhouette
- SOM-SC
- SyncNet and Sync-SOM
- TTSAS
- X-Means
Oscillatory Networks and Neural Networks
The Oscillatory Neural Networks (ONN) and Neural Networks (NN) are located in the Python module “pyclustering.nnet”. There is a list of networks supported by Pyclustering.
An oscillatory neural network (ONN) is a type of artificial neural network in which the neurons are connected to oscillators. Oscillatory neural networks are inspired by the occurrence of neural oscillations in the brain and are closely related to the Kuramoto model. To detect pictures, oscillatory neural networks have been developed.
- Chaotic Neural Network(CNN)
- Pulse-Coupled Neural Network (PCNN)
- Self-Organized Map (SOM)
- Oscillatory neural network based on Kuramoto model (Sync)
- Oscillatory neural network for pattern recognition (SyncPR)
- Oscillatory neural network for image segmentation (SyncSegm)
- Oscillatory neural network based on Landau-Stuart equation and Kuramoto model (fSync)
- Oscillatory neural network based on Hodgkin-Huxley model (HHN)
- Hysteresis Oscillatory Network
- Local Excitatory Global Inhibitory Oscillatory Network (LEGION)
Graph Coloring Algorithms
Graph Coloring Algorithms are located in the Python module “pyclustering.gcolor”. Graph colouring is a subset of graph labelling; it involves the assignment of labels to nodes of a graph subject to specific criteria. It is a method of colouring the vertices of a graph so that no two neighbouring vertices are the same colour. Three different types of techniques are used.
- DSatur
- Hysteresis
- GColorSync
Containers
There are two types of containers used by Pycluster to build a tree in n-dimensional space to search data points for the clustering. In python, it is present in a “pyclustering.container”:
- KD Tree
- CF Tree
About OPTICS
Many real-data sets have the critical trait that their underlying cluster structure cannot be described by global density parameters. To identify clusters in various locations of the data space, very different local densities may be required. A density-based clustering approach is Ordering Points To Identify Clustering Structure (OPTICS).
The essential principle of density-based clustering is that the neighbourhood of a certain radius must contain at least a minimal number of objects (MinPts), i.e. the cardinality of the neighbourhood must surpass a threshold. OPTICS generates a database order, storing the core distance and a reasonable reachability distance for each item.
How does this work?
OPTICS works similar to DBSCAN; it will start with retrieving the maximum distance neighbourhood of the object passed from the main loop OPTICS, sets its reachability-distance to UNDEFINED and determines its core distance.
The object is then checked for the core object attribute, and if it is not a core object at the generating distance, control is simply returned to the main loop OPTICS, which chooses the next unprocessed object in the database. Otherwise, if the item is a core object at a distance less than the maximum distance, it iteratively gathers directly density-reachable objects concerning the maximum distance and a minimum number of objects.
Objects that are directly density-reachable from a present core object are added to the OrderSeeds seed list for future growth. OrderSeeds objects are arranged by reachability-distance to the closest core object from which they have been directly density reachable.
In each cycle, the current object in the seed list with the shortest reachability distance is chosen. This object’s maximum distance neighbourhood and core distance are determined. The item is then simply saved together with its core distance and current reachability distance. If the existing object is a core object, more expansion candidates may be added to the seed list.
How does OPTICS differ from DBSCAN?
- The OPTICS clustering approach consumes more memory since it uses a priority queue (Min Heap) to select the next data point in terms of Reachability Distance that is closest to the point presently being processed. It also needs greater computer resources since nearest neighbour queries in DBSCAN are more complex than radius queries.
- The OPTICS clustering algorithm does not require the epsilon parameter and is merely included in the pseudo-code above to decrease the time required. As a result, the analytical process of parameter adjustment is simplified.
- OPTICS does not divide the input data into clusters. It just generates a Reachability distance plot, and it is up to the coder to analyse it and cluster the points accordingly.
How to Implement OPTICS using Pyclustering?
Let’s install the Pyclustering to get started with the OPTICS algorithms.
! pip3 install pyclustering
Import necessary libraries
import random
from pyclustering.cluster import cluster_visualizer,cluster_visualizer_multidim
from pyclustering.cluster.optics import optics, ordering_analyser, ordering_visualizer
from pyclustering.utils import read_sample, timedcall
from pyclustering.samples.definitions import SIMPLE_SAMPLES,FCPS_SAMPLES,FAMOUS_SAMPLES
Using the sample data provided by the Pyclustering itself and performing OPTICS algorithm to cluster the raw data and analyse the results.
sample = read_sample(FCPS_SAMPLES.SAMPLE_TWO_DIAMONDS)
radius_cluster = 0.2
num_neighbors = 10
optics_model = optics(sample, radius_cluster, num_neighbors)
optics_model.process()
clusters = optics_model.get_clusters()
noise = optics_model.get_noise()
ordering = optics_model.get_ordering()
Defining the radius for the cluster and the number of neighbours is necessary for the algorithm. The clusters formed by the OPTICS algorithm are stored by using “.get_clusters”. Similarly, information about the input data set’s noise and clustering ordering is extracted. The data-set clustering ordering contains information on the internal clustering structure following the connectivity radius.
Analysing the clusters formed with the sample. Plotting the histogram of the number of clusters formed to check the distribution and spread of data points in each cluster.
plots = cluster_visualizer()
plots.append_clusters(clusters, sample)
plots.show()

analyser_cluster = ordering_analyser(ordering)
ordering_visualizer.show_ordering_diagram(analyser_cluster, 2)
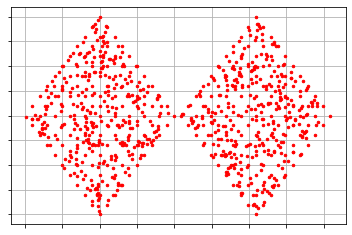

As we can observe that the cluster is approximately the same as the sample. The clusters also maintain the shape of the diamond just like the sample. As mentioned above the radius of the cluster is 0.2 and in the representation, we can observe that the radius of the cluster is approximately 0.2. There are a total of 2 clusters formed by the algorithm and by the distribution it could be said they are perfectly formed.
Let’s implement this on multidimensional data since the previous data was two dimensional. Everything in the code would be the same except the visualisation part. As this is multidimensional data, I need to use “cluster_visualizer_multidim()” instead of “ cluster_visualizer()”.
sample = read_sample(FAMOUS_SAMPLES.SAMPLE_IRIS)
radius_cluster = 0.5
num_neighbors = 10
optics_model = optics(sample, radius_cluster, num_neighbors)
optics_model.process()
clusters = optics_model.get_clusters()
noise = optics_model.get_noise()
ordering = optics_model.get_ordering()

plots = cluster_visualizer_multidim()
plots.append_clusters(clusters, sample)
plots.show()

analyser_cluster = ordering_analyser(ordering)
ordering_visualizer.show_ordering_diagram(analyser_cluster, 3)
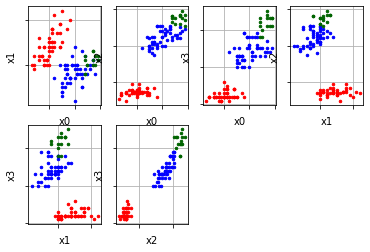

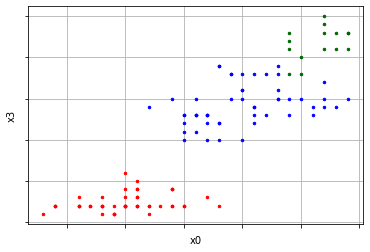
In the above representation, there are six plots of clusters which represents six different dimensions of the data. One can also visualise a single dimension by the following code.
plots = cluster_visualizer_multidim()
plots.append_clusters(clusters, sample)
plots.show(pair_filter=[[0,3]])
Conclusion
PyClustering is a data mining package which supports a great list of clustering algorithms which make it flexible to operate. Since it uses Numpy for mathematical operation and parallel processing makes the processing faster. With this article, we understood the package and modules offered by the package with the implementation of OPTICS on both two dimensional and multidimensional data.