Statisticians have been debating about which one is better the Bayesian approach or the Frequentist approach because they both work on different methodologies. In the past, A/B testing has tendered towards Frequentist solutions. However, Bayesian methods offer an appealing way of calculating experiment results that is entirely different from Frequentist. So in this article, we will discuss Frequentist and Bayesian approaches in detail. Following are the topics to be covered in this article.
Table of contents
- What are Bayesian and Frequentist statistics?
- Why both of them are important?
- How these two are used in python?
Using only the data from the current experiment, Frequentists predict the underlying truths of the experiment whereas the Bayesian method uses the past experiment data also to understand the current experimental data and make predictions.
Let’s deep dive into these two statistical methods and understand the fundamentals.
What are Bayesian and Frequentist statistics?
Bayesian inference interprets probability as a measure of the belief or confidence that an individual might hold regarding the likelihood of an event occurring and the prior beliefs about an event will likely change when new information is revealed. Bayesian statistics gives a solid mathematical means of incorporating the prior beliefs, and evidence, to produce new posterior beliefs.
The frequentist inference interprets probability as the frequency of repeatable experiments and the gathering of information. So, having large samples solves most problems because the sample becomes closer to the true population distribution. The frequentist inference has a lack of context and is completely dependent on the drawn sample.
Solving a problem
Consider an unfair coin flip problem in which need to find the probability of an unfair coin coming up heads. Let’s solve this problem with help of both of the above approaches.
With the Frequentist approach, the probability of seeing heads when flipping an unfair coin over some time is the long-run relative frequency of seeing heads. In other words, as the coin is flipped more, the number of heads received as a percentage of the overall flips tends to correspond to the “true” probability of the coin landing on its head. Particularly, the person experimenting doesn’t consider their own beliefs about the fairness of other coins.
With the Bayesian inference, an individual may believe the coin to be fair before flipping it but the coin keeps coming up heads after a few flips. As a result, the belief about the fairness of the coin is modified to take into account the possibility that three heads have appeared in a row and the coin might not be fair. The individual believes the coin is unlikely to be fair after 500 flips with 400 heads. This is a significant change from the individual’s prior belief.
Are you looking for a complete repository of Python libraries used in data science, check out here.
Why both of them are important?
In A/B testing, a statement is stated as “The 95% confidence interval can be exceeded in fewer than 5% of implemented variations”. With the use of the Frequentist method which calculates statistical significance because they can reliably predict future performance by using mathematical formulas. It relies on the p-value method.
Bayesian calculations could be led to an incorrect conclusion considering to above statement because of the risk that prior experiment knowledge may not match how an effect is being generated in a new experiment, and it’s possible to be led astray if does not account for it.
So, for A/B testing Frequentist method is optimal and for every other statistical operation where relying on the p-value could lead to bad results Bayesian inference is implemented.
How these two are used in python?
Frequentist test
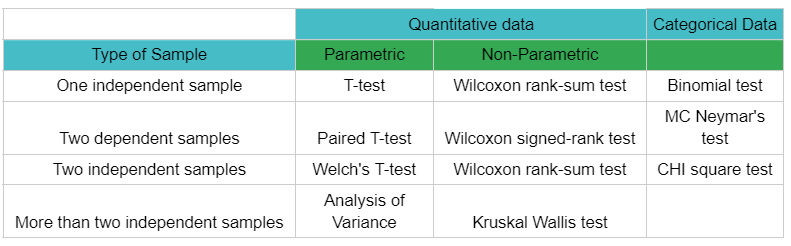
The Frequentist test is a hypothesis testing so we can use any test from the below-given chart. Let’s implement any one of the below-given hypothesis testing methods.
Two-sample t-test
The two sample t-test could be used for testing both dependence and independence of the samples.
The objective is to check if sample_1 and sample_2 have the same mean.
- Null hypothesis (H0): Sample_1 and Sample_2 have the same mean (dependent).
- Alternative hypothesis (Ha): Sample_1 and Sample_2 have different mean (independent).
Import libraries:
import numpy as np
from scipy import stats
Creating normalised samples
sample_1=stats.norm.rvs(loc=2000,scale=500,size=100)
sample_2=stats.norm.rvs(loc=1000,scale=500,size=100)
Two array samples will be generated with 100 sample size and each having random values.
Testing the sample for independence:
print("T statistics value:",stats.ttest_ind(sample_1,sample_2)[0],"\nP-value:",stats.ttest_ind(sample_1,sample_2)[1])
T statistics value: 14.143
P-value: 7.58407491582331e-32
As the result shows the p-value is less than the margin of error (alpha=0.05) therefore we can reject the null hypothesis this means both the samples have different mean values.
Bayesian test
In this test, we will be implementing a model which gives Bayesian inferences based on the Markov chain Monte Carlo.
The objective is to predict the true number of packing materials sold by a company per hour. We will assume that there is no variation in the manufacturing of the material.
Install emcee library:
! pip install -U emcee
Import libraries:
import emcee
import numpy as np
from scipy import stats
Building necessary functions for model
a= 2000
new=sample_1
new_e=np.sqrt(new)

def log_prior(theta):
    return 1  # flat prior

def log_likelihood(theta, F, e):
    return -0.5 * np.sum(np.log(2 * np.pi * e ** 2)
                         + (F - theta[0]) ** 2 / e ** 2)

def log_posterior(theta, F, e):
    return log_prior(theta) + log_likelihood(theta, F, e)
All the parameters needed for the bayesian’s theorem are created using the formulas.
ndim = 1
nwalkers = 100
nburn = 1000
nsteps = 2000
starting_guesses = 2000 * np.random.rand(nwalkers, ndim)
Variables necessary for the Markov chain Monte Carlo like the number of features in the samples, the number of walkers which are the samplers sampling around the data, etc.
Build the model:
model= emcee.EnsembleSampler(nwalkers, ndim, log_posterior, args=[new, new_e])
model.run_mcmc(starting_guesses, nsteps)

sample = model.chain
sample = model.chain[:, nburn:, :].ravel()
print("""
      true = {0}
      test  = {1:.0f} +/- {2:.0f} (based on {3} measurements)
      """.format(a, np.mean(sample), np.std(sample), 100))
So the actual number of items was 2000 and the predicted value is 1861 which is very much close to the actual number.
Final Word
According to Frequentists, probability is related to the frequency of repeated events, whereas Bayesian thinks of probability as a measure of uncertainty. With a hands-on implementation of this concept in this article, we could understand the difference and importance of Frequentist and Bayesian approaches in statistics.